Trading Display
Configure how P&L values, breakeven thresholds, tags, custom columns, and column visibility are displayed in the trade log.
Trading Display
Control how trading data is presented across the app. Access this page in Settings → Trading.

The page is a single-column layout with five sections: P&L Display Mode, Breakeven Threshold, Tags, Custom Columns, and Column Visibility.
Scope Toggle (Global vs. Per-Account)
P&L Display Mode and Breakeven Threshold both support a scope toggle:
| Scope | Behavior |
|---|---|
| All Accounts (global) | The setting applies to every account unless an account override exists |
| Account Name | Overrides the global setting for that specific account only |
Switch scope by clicking the toggle at the top of the section. When viewing a per-account override, a Reset button appears — clicking it removes the override and reverts to the global value.
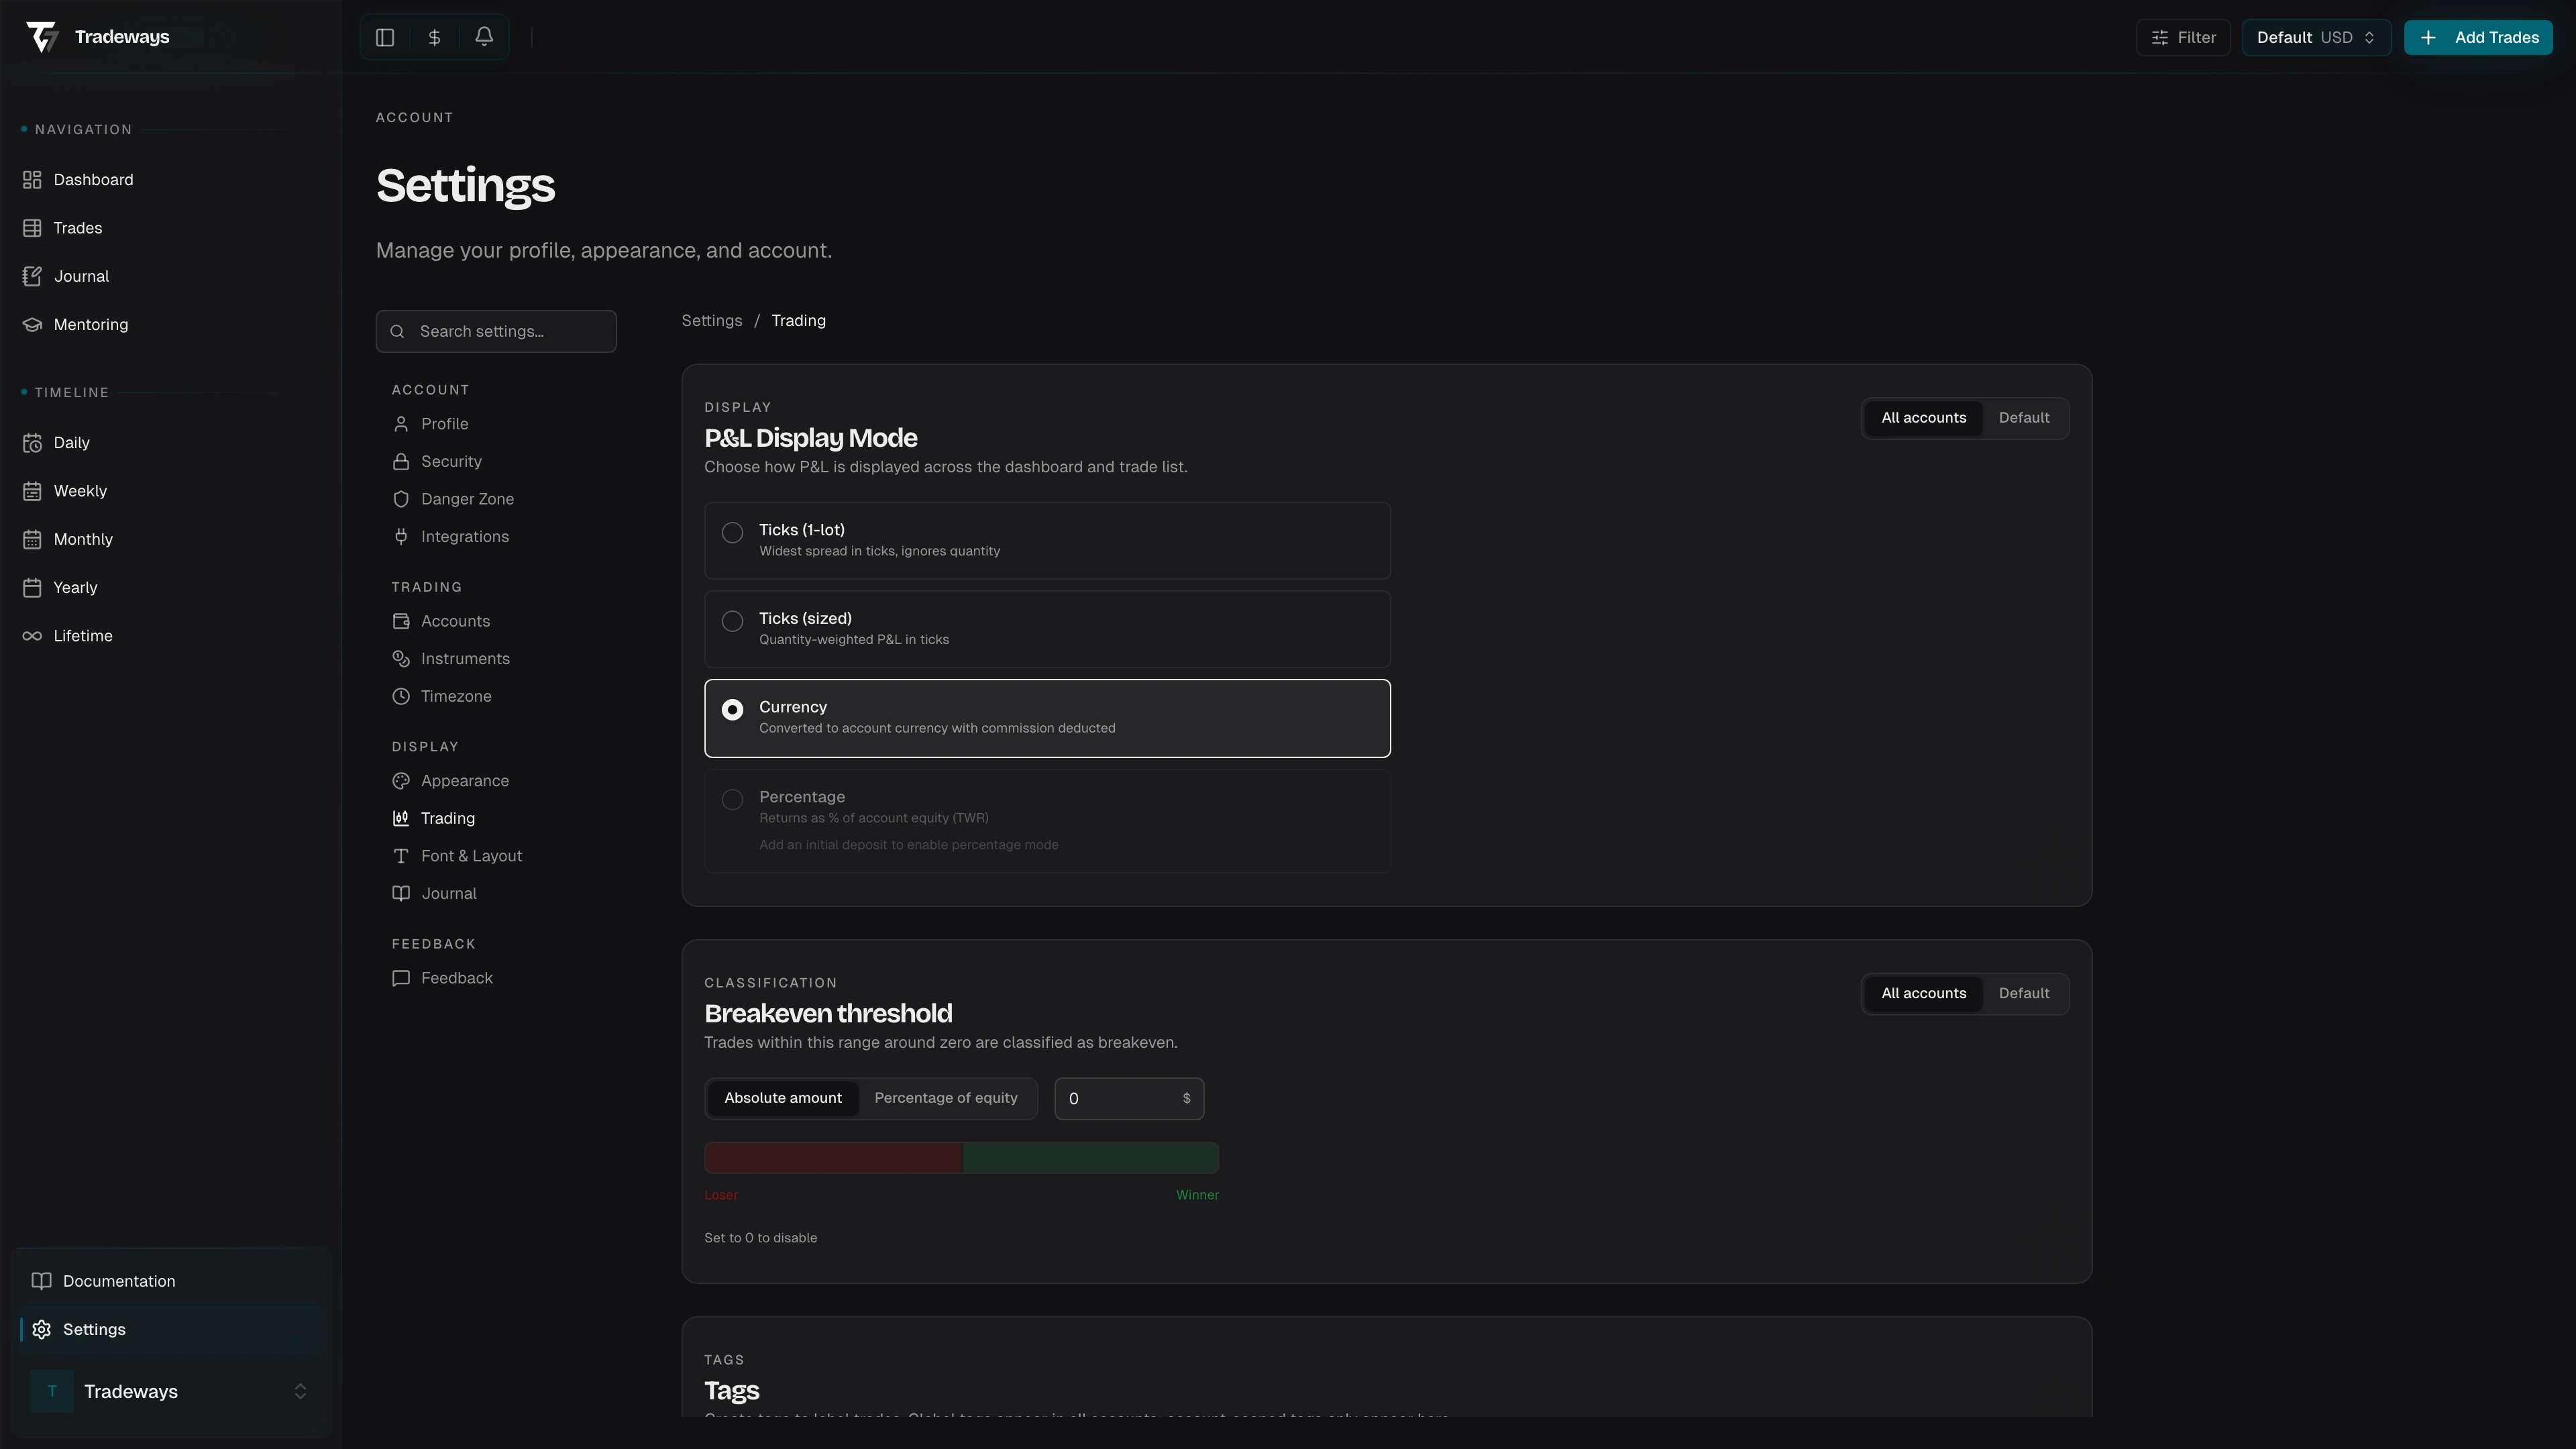
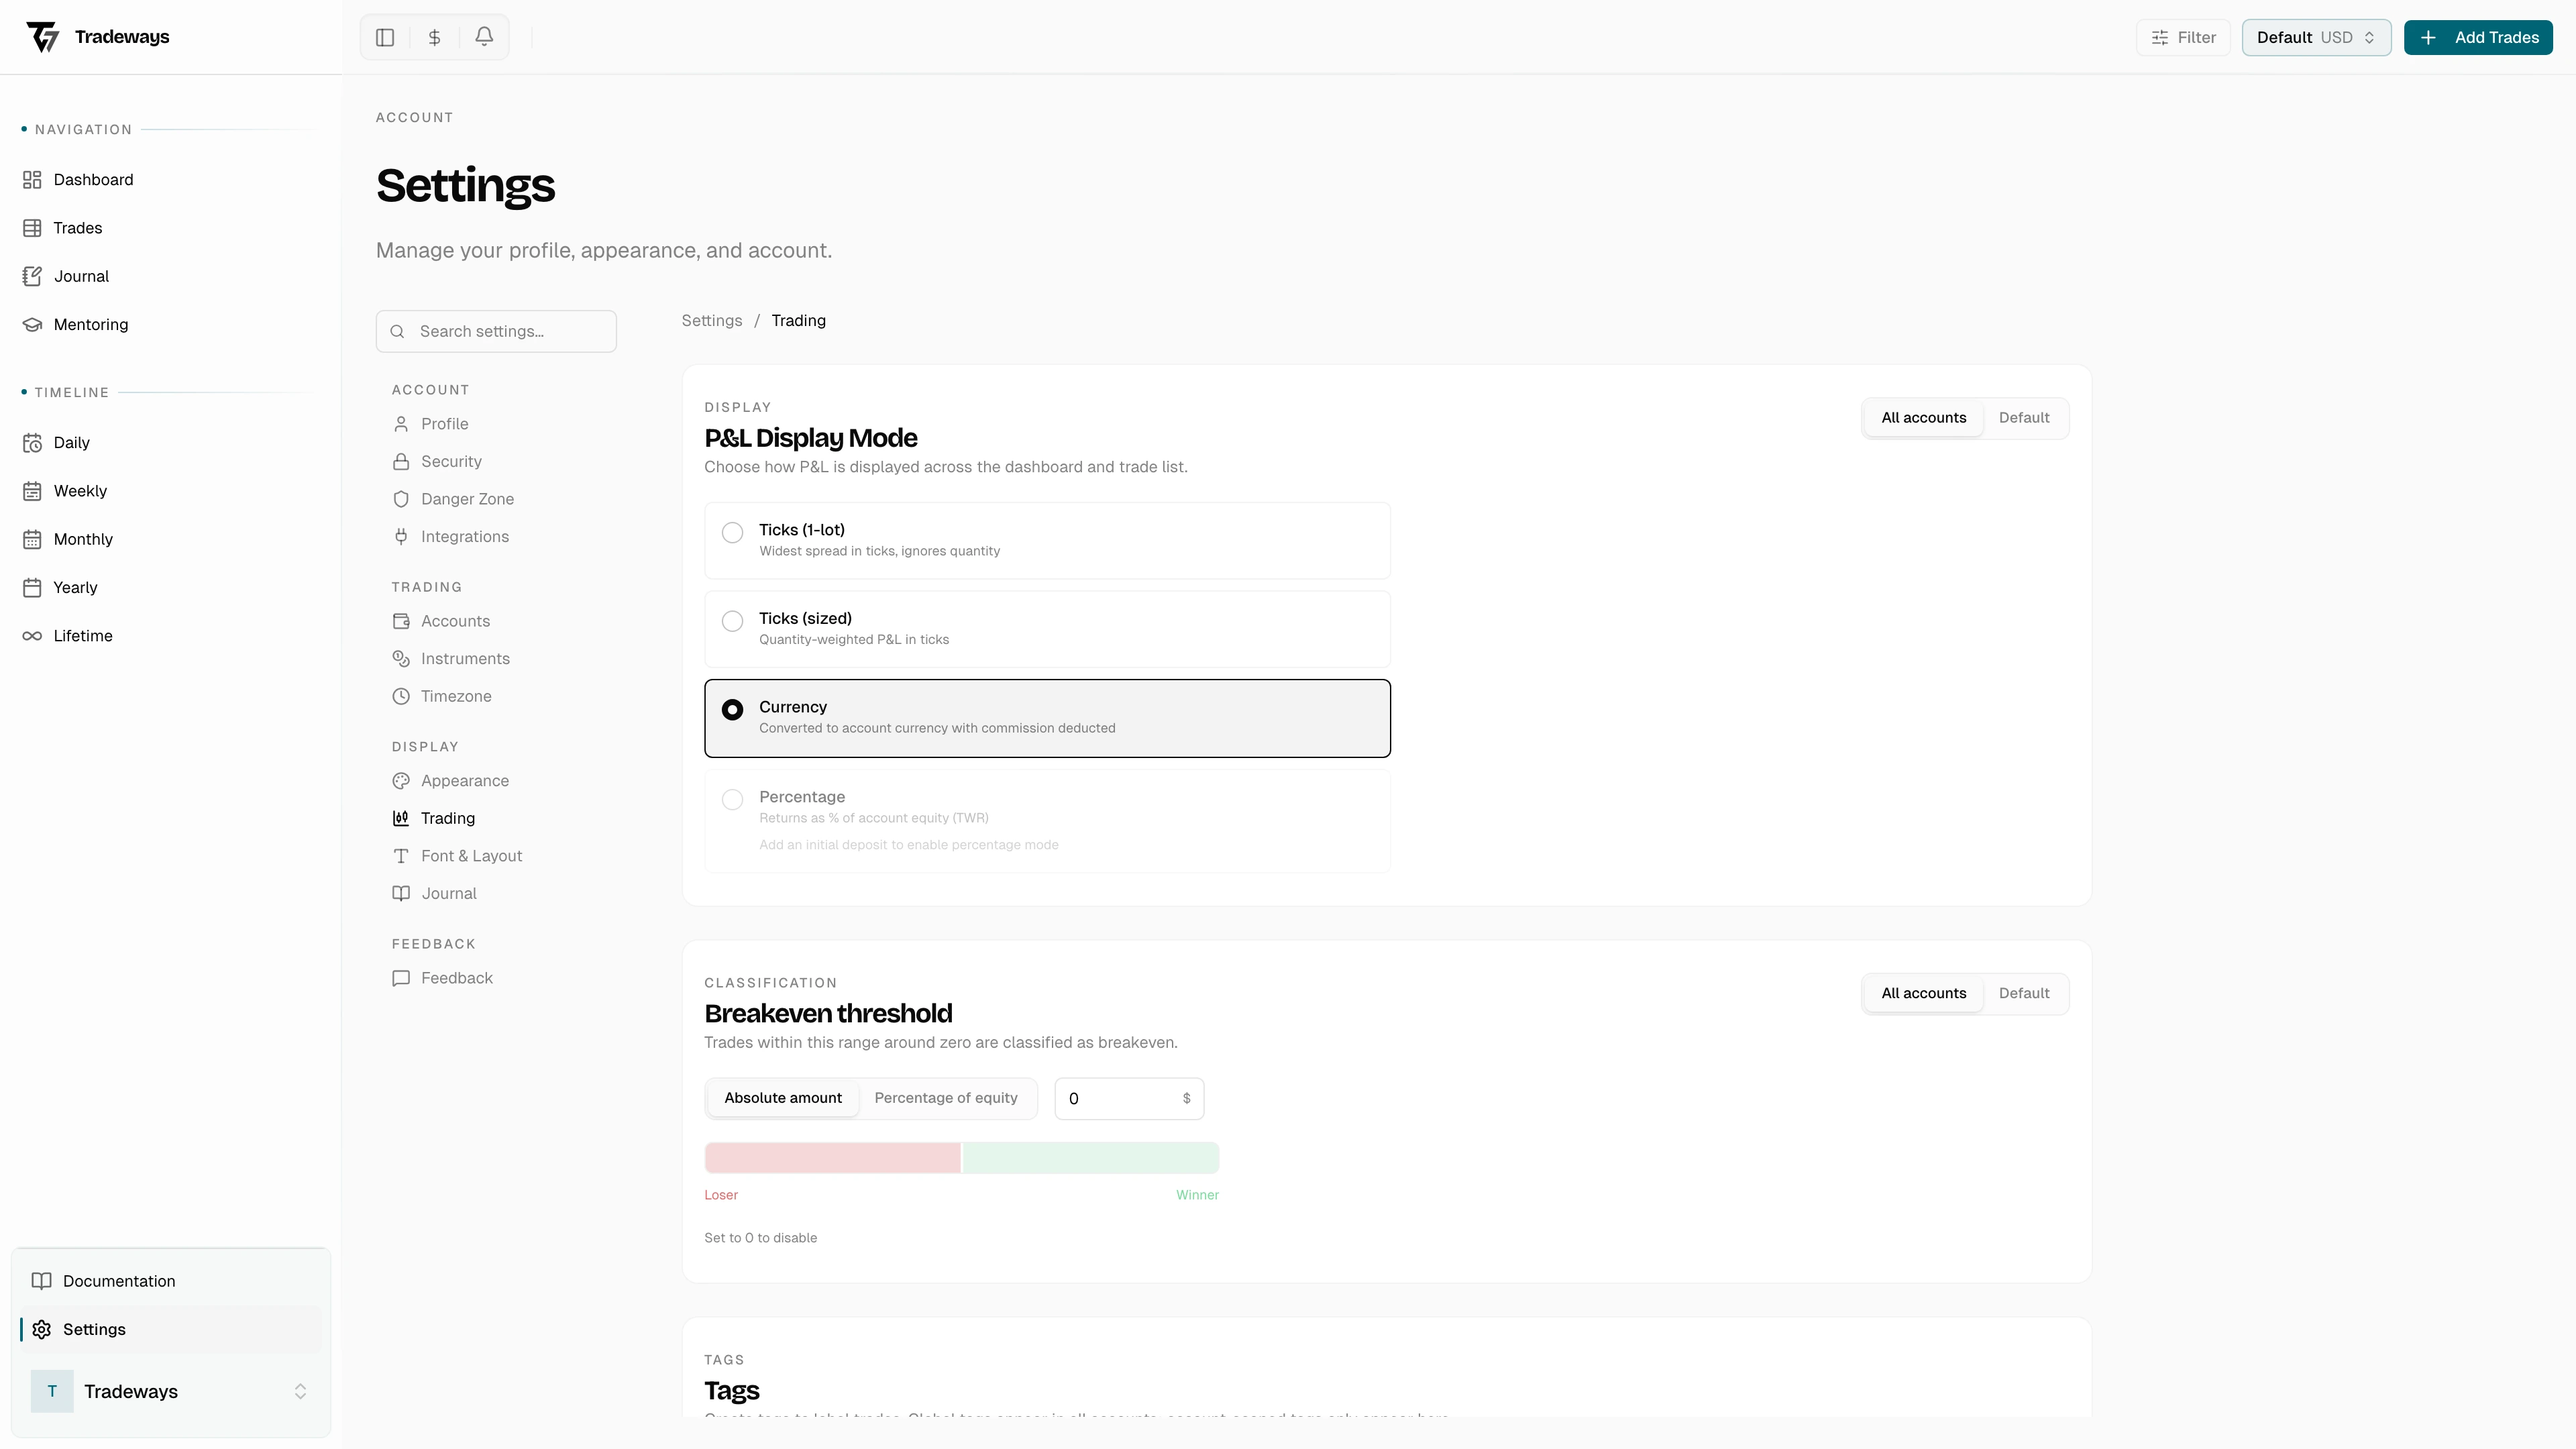
P&L Display Mode
Choose how profit and loss values are shown throughout the app.


Four options, presented as radio button cards:
| Mode | Description |
|---|---|
| Currency | P&L in the account's settlement currency (USD, EUR, etc.) |
| Ticks (1 Lot) | P&L in instrument units (ticks, pips, points, cents) normalized to 1 standard lot. Label adapts to the asset class. |
| Ticks (Sized) | P&L in instrument units scaled to your actual position size |
| Percentage | Return as a percentage of equity |
Percentage mode requires at least one account transaction to calculate equity. The first transaction is the account's starting balance and may be 0 for prop or unfunded accounts. If no transactions exist, the option is disabled with the hint: "Add a starting balance to enable percentage mode."
Breakeven Threshold
Define the range around zero where a trade is classified as "breakeven" instead of a win or loss.


- Unit toggle — switch between an absolute currency amount ($) and a percentage of equity (%).
- Value input — currency: $0 to $1,000,000. Percentage: 0% to 100%. Set to 0 to disable the breakeven zone entirely.
- Visual indicator — a horizontal bar showing three colored zones: red (Loser) | gray (Breakeven) | green (Winner). The bar adjusts dynamically as you change the threshold value.
Scope toggle works the same as P&L Display Mode (see above).
Tags
Create colored labels to categorize trades. Tags are managed per account.


See Tags for full documentation on creating, editing, reordering, and scoping tags.
Custom Columns
Add user-defined fields to the trade log. Columns are managed per account.


See Custom Columns for full documentation on column types, creation, and management.
Column Visibility
Toggle which standard columns appear in the trade log. Presented as a grid of checkboxes.

Available columns: Symbol, Images, Direction, Month, CW, Weekday, Date, Open, Close, State, Qty, Avg Entry, TP, SL, Tech RR, RR, Gross P&L, Commission, P&L.
Column visibility is a global setting — it applies to all accounts. Hidden columns retain their data; toggling them back on restores the values.