Tradeways Score
A 0–100 index across four pillars (Edge, Risk, Consistency, Discipline) that points to your weakest pillar first.
Tradeways Score
The Score is your single 0–100 read on how you are trading right now. It is not a leaderboard. It is a diagnostic that tells you which part of your trading is the bottleneck, so the next thing you work on isn't guesswork.
It is calculated for the active account over the last 90 days of closed trades, as the equal-weighted average of four pillar scores: Edge, Risk, Consistency, and Discipline. Each pillar's sub-metrics are normalised on smooth curves, so a small change in a raw number produces a small change in the score. There are no hard thresholds that flip you a tier on a single trade.


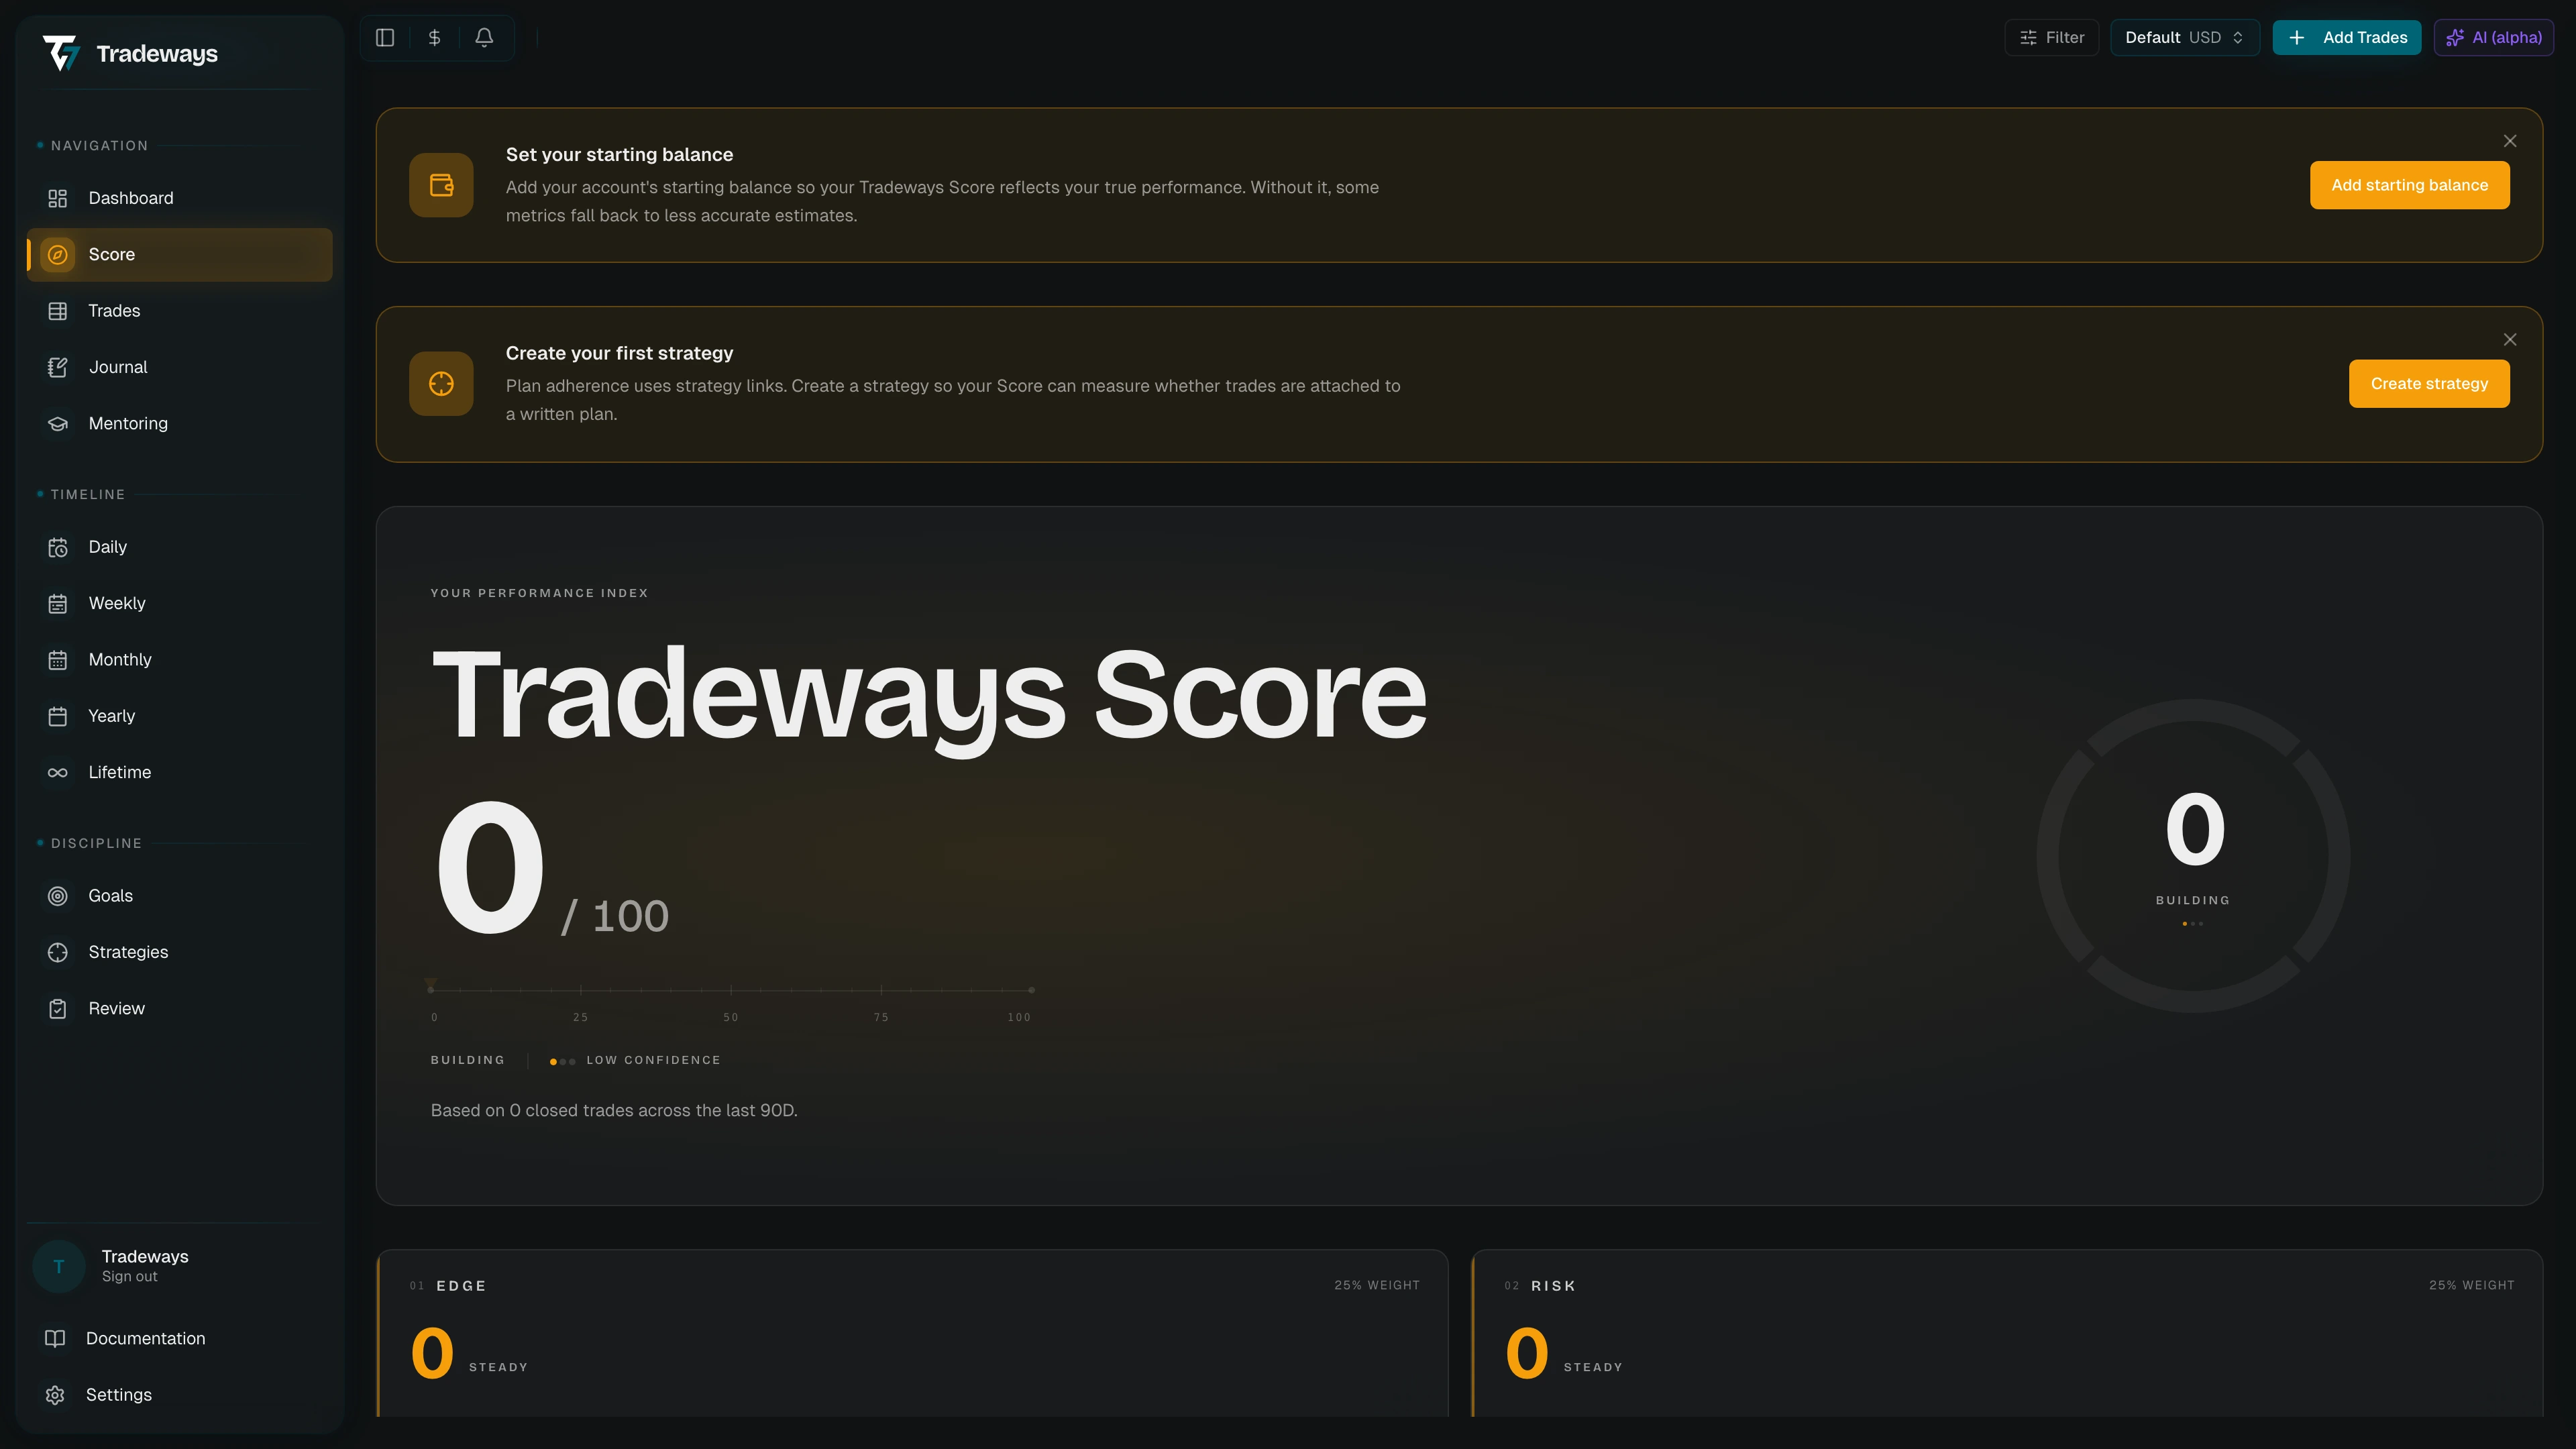
At the top of the page you see the overall number out of 100, the tier (ELITE, STRONG, STEADY, BUILDING, or FRAGILE), the change versus your score 30 days ago, and a confidence label (LOW, MEDIUM, or HIGH CONFIDENCE) that reflects sample size. A small bar below the number shows where you fall inside the current tier's band. To the right is a circular gauge with one segment per pillar; click a segment to jump to that pillar's card.
Confidence matters: with fewer than 30 closed trades the score is pulled toward 50 so one outlier trade can't fake a great result. Between 30 and 99 trades it is pulled partway. At 100+ trades the score reflects your data with minimal damping.
Two callouts can appear when the account isn't ready for a full score. The first asks you to add a starting balance, without which percentage-based risk metrics can't be computed. The second asks you to create a strategy on /strategies, because Plan adherence under Discipline needs trades linked to a written plan. Both are dismissible per account.
Pillars

Each pillar has its own card with a 0–100 pillar score, its 25% weight, two concrete improvement tips, and the sub-metrics that feed it. Hover any sub-metric row to read the full definition.
Edge
Edge is the math of profitability: are your winners big enough, given how often you win, to come out ahead after costs? It tolerates a low hit rate when winners are large, and punishes a high hit rate when losers wipe the winners out. The sub-metrics below are the levers, and Expectancy R is the main one to watch.
| Sub-metric | What it measures |
|---|---|
| Expectancy R | Average reward-to-risk per trade. 2R is strong, 3R is required for a perfect score. |
| Profit factor | Gross profit divided by absolute gross loss. Above 1.5 is healthy. |
| Hit rate | Share of closed trades that finished green. 50% scores strongly; 70% gives a perfect score. |
Risk
Risk is whether you survive a bad run. Small, percentage-based losses defined before you enter: that is the entire job. Two of the three sub-metrics here can blow your account by themselves if you let them, which is why this pillar is usually the one to fix first when the Score is low.
| Sub-metric | What it measures |
|---|---|
| Max drawdown | Largest peak-to-trough drop in equity, as a percent of peak. Smaller is better. |
| Recovery factor | Net profit divided by max drawdown. Above 2 means every unit of drawdown was more than recovered. |
| Risk sizing | 90th-percentile risk per trade, from stop distance and quantity when both are available, otherwise from realised losing-trade loss. Repeated 2%+ and 5%+ trades hurt. |
The Risk card also shows a small "Active risk rules" panel with your account tier (small account vs. standard rules), your p90 risk per trade, and where you stand against the active thresholds. It is the same logic that surfaces risk warnings on the dashboard.
Consistency
Consistency is whether the equity curve actually climbs or just zig-zags around break-even. Two shapes are valid: a low hit rate carried by big winners, or a high hit rate with steady small wins. The score doesn't care which, as long as the line slopes up.
| Sub-metric | What it measures |
|---|---|
| Equity-curve R² | How linear your cumulative P&L is. 1.0 is a perfect straight line up. |
| % Winning days | Share of trading days that finished green. |
Discipline
Discipline is the part of trading you actually control. For most traders, knowledge isn't the bottleneck; execution is. This pillar is also the easiest to move deliberately: it doesn't require a new edge, just consistent habits after the trade.
| Sub-metric | What it measures |
|---|---|
| Loss-size variability | Coefficient of variation of your realised losses. Low values mean capped, predictable losses; high values mean one outlier can undo everything else. |
| Plan adherence | Share of trades linked to a strategy on /strategies. A proxy for trading a written plan. |
| Journal completeness | Share of closed trades covered by an execution note, screenshot, review tag, trade note, or a daily/weekly journal entry on the trade's date. |
Score history
Below the pillars, a line chart plots your Score over time with the five tier bands shaded behind it. Hover any point to see the score value, the date, and how many trades contributed that day. With too little history the chart waits until more days have closed before drawing a line.
Sub-metric comparison
The radar chart plots every sub-metric from all four pillars on one 0–100 ring, with the previous 90 days overlaid for comparison. It's the fastest way to spot which sub-metrics are pulling weight and which are dragging. The axis labels match the pillar cards above.
Tiers
The tier in the header maps your overall score to a status. The bands are also shaded behind the history chart.
| Tier | Band | What it means |
|---|---|---|
| ELITE | Top | All four pillars strong at the same time. Rare and earned. |
| STRONG | High | Multiple pillars firing; usually one weakness left to address. |
| STEADY | Mid | Working strategy, predictable habits. Most traders live here. |
| BUILDING | Low | Habits forming, pillars uneven. Pick one and lift it. |
| FRAGILE | Bottom | High risk of blow-up. Fix Risk first, then Discipline, before chasing more Edge. |
What the Score is for
The three cards at the bottom of the page restate this: it's a 0–100 index, not a leaderboard, and it's there to tell you where to look first. Each pillar weighs 25%, sub-metrics are normalised on smooth curves, and thin-data scores are damped toward neutral. The four pillars cover the four things that have to be true at once: you have a strategy, you survive bad runs, the curve climbs, and you execute the plan you wrote. None of them is sufficient on its own.