Chart Drawings
Reference for chart drawings in Tradeways — available drawing tools, how they are persisted, and how they appear on trade charts.
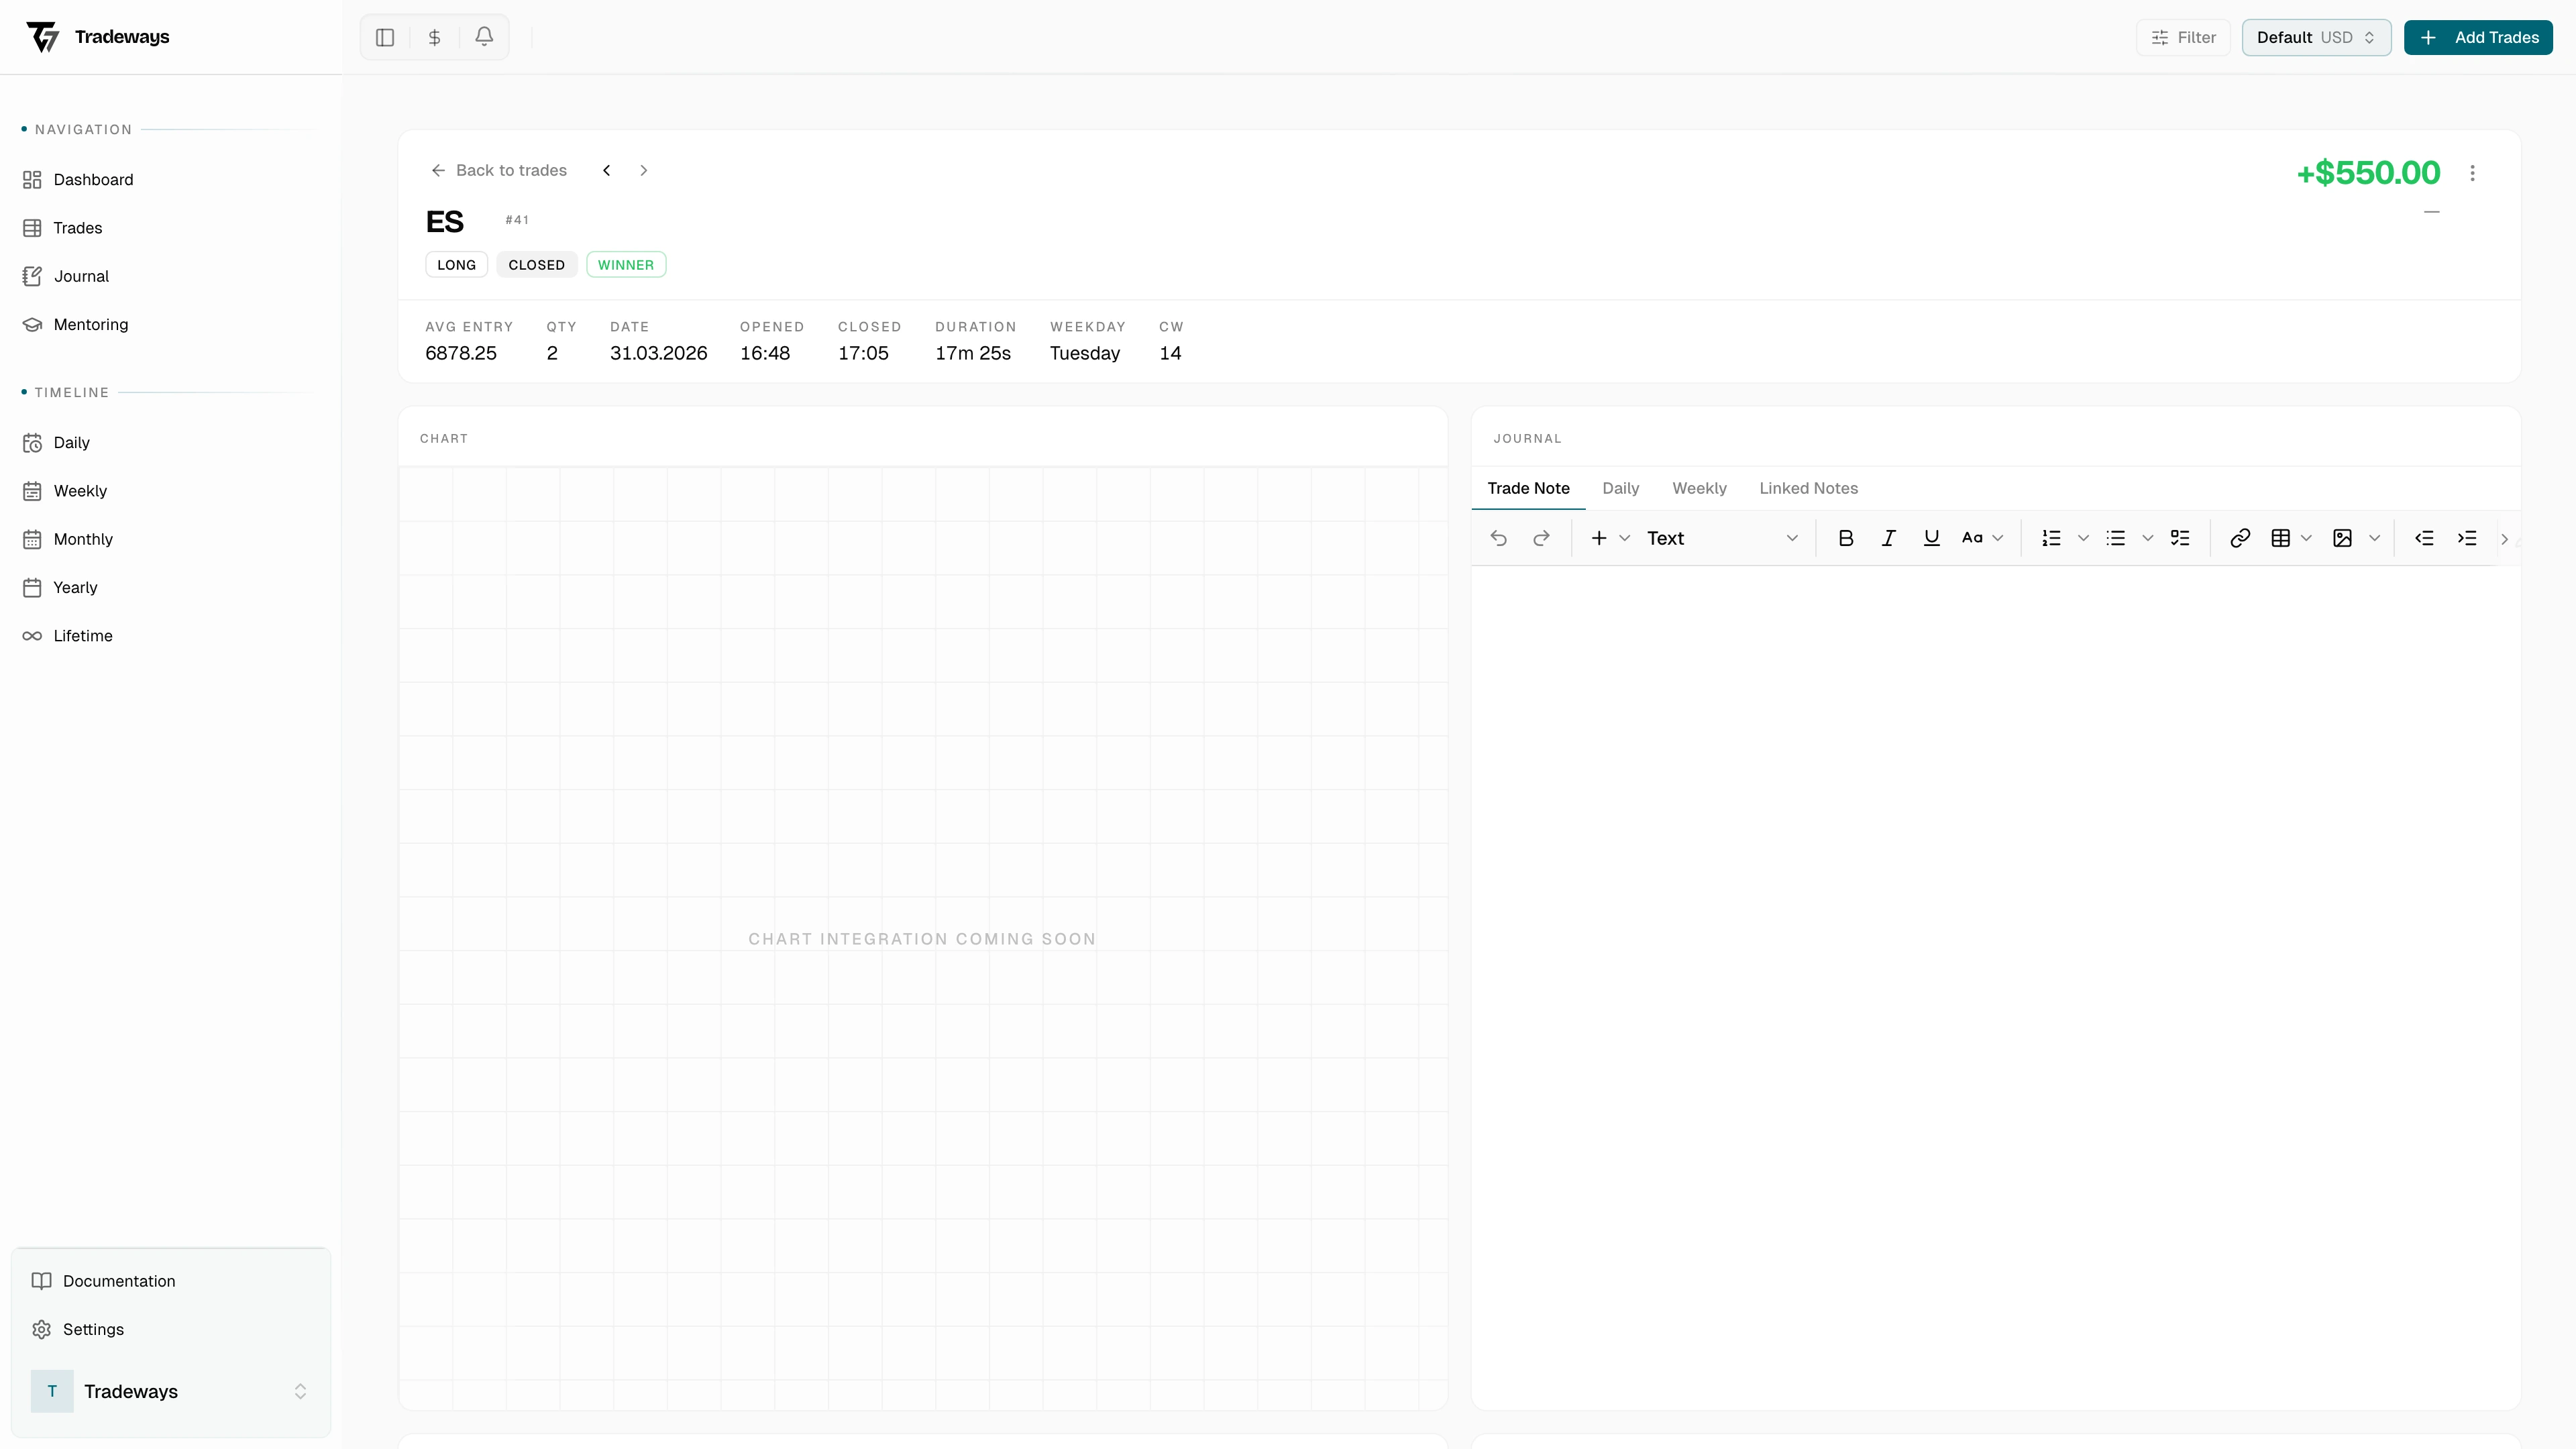
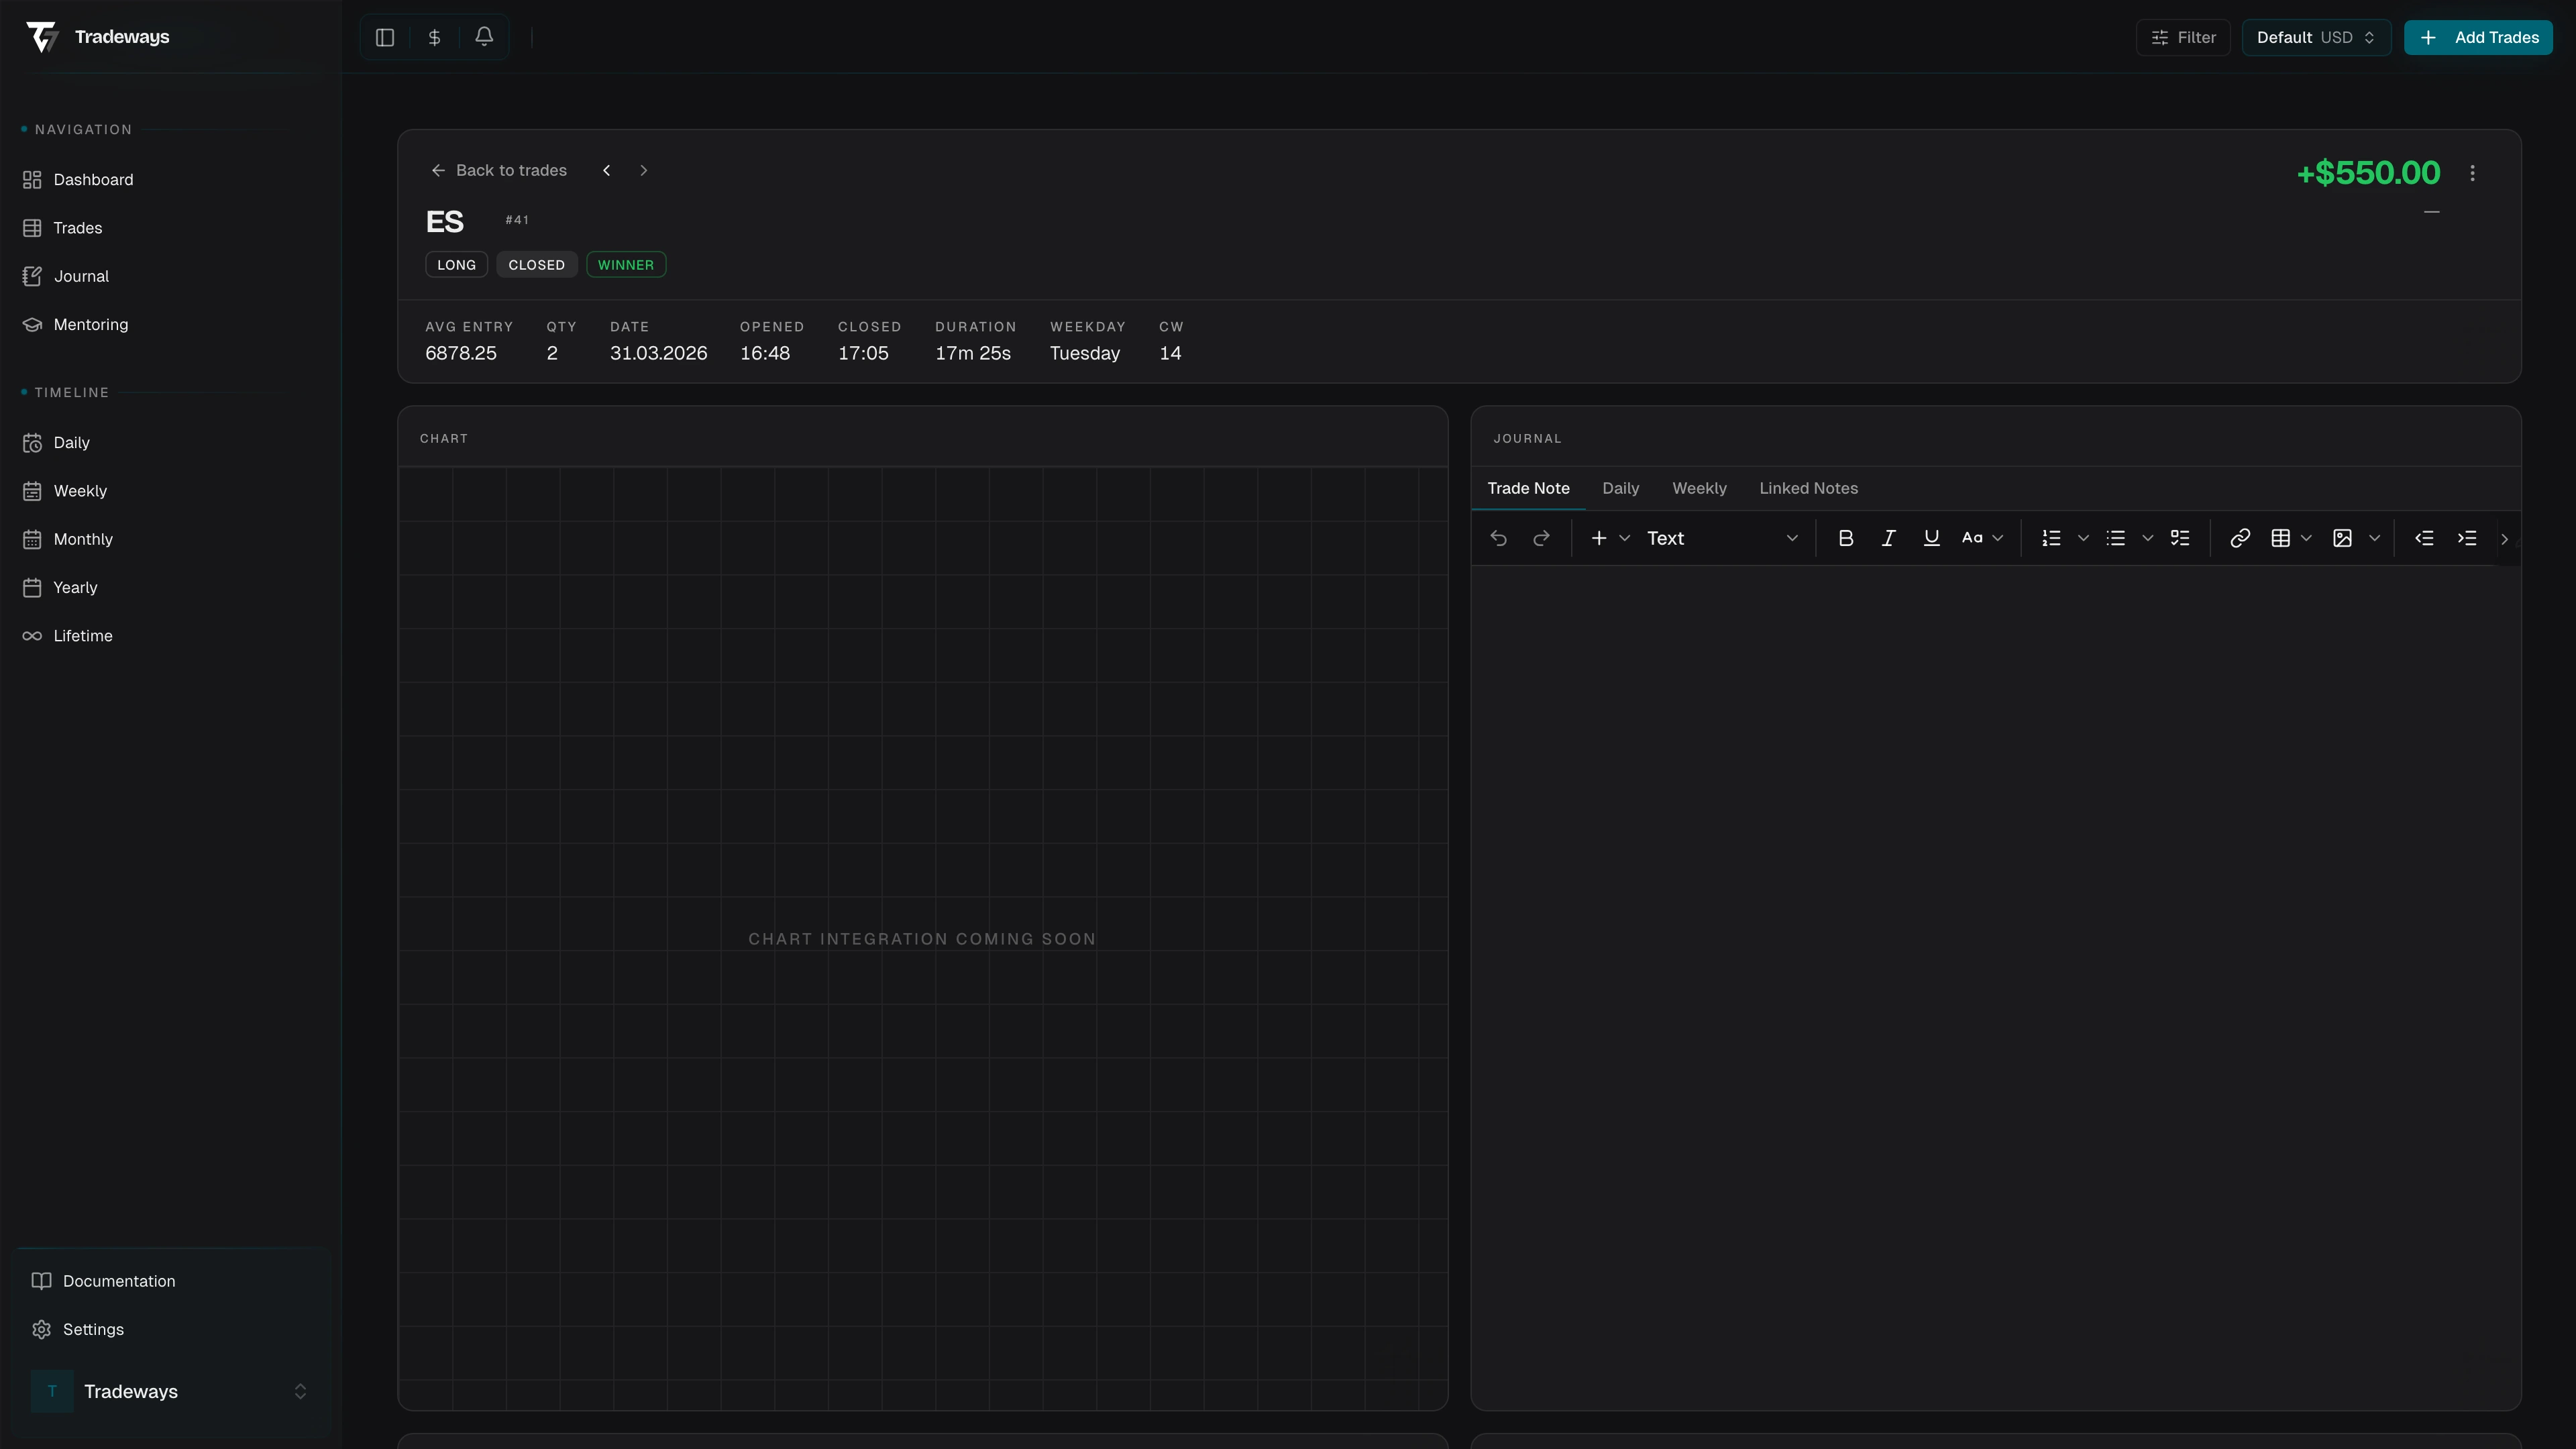
Chart drawings are technical-analysis overlays that you place on a trade's price chart. They are saved per trade and sync in real time, so drawings persist across sessions and devices.
Available Drawing Tools
| Tool | Description |
|---|---|
| Horizontal Line | An infinite horizontal line at a specific price level. |
| Segment | A straight line between two points (time + price). |
| Horizontal Ray | A horizontal line that extends from a point to the right edge of the chart. |
| Price Line | A labeled horizontal line showing the exact price value. |
| Rectangle | A rectangular zone defined by two corner points (time + price). |
A Cursor tool is always available to switch back from drawing mode to normal chart interaction.
Delete All
A dedicated "Delete All" button removes every user-created drawing from the current trade chart in a single action.
Persistence
Each drawing is stored as a separate record linked to a specific trade. The stored data includes:
| Field | Description |
|---|---|
| Overlay name | The drawing tool type (e.g. Horizontal Line, Segment, Rectangle) |
| Points | Array of anchor points, each with an optional timestamp and price value |
| Styles | Optional JSON string containing custom visual styling |
| Extended data | Optional JSON string for tool-specific metadata |
| Locked | Whether the drawing is locked against accidental moves |
Limits
Each trade supports a maximum of 50 drawings. Attempting to add more will result in an error.
Sync Behavior
New drawings save the moment the drawing gesture completes. Moving a drawing auto-saves once you release it. Deletions are committed immediately. Drawings load automatically when the trade chart opens, and changes made on one device appear on others in real time.
How Drawings Differ from Trade Markers
Drawings are user-created overlays for analysis. They are distinct from the system-generated trade markers (entry/exit arrows, stop-loss/take-profit lines, risk/reward zones) that Tradeways places automatically based on execution data and trade levels.