Daily View
Review a single trading day with its trades, intraday timeline, and journal note.
Daily View
Open the daily view when you want to relive a specific session: what you actually did, in what order, and what it cost or paid. Step through days with the arrows in the header, or jump to a date through the calendar popover. The header summarises the day in one line (P&L, trade count, win rate) and toggles between currency and TWR percentage.
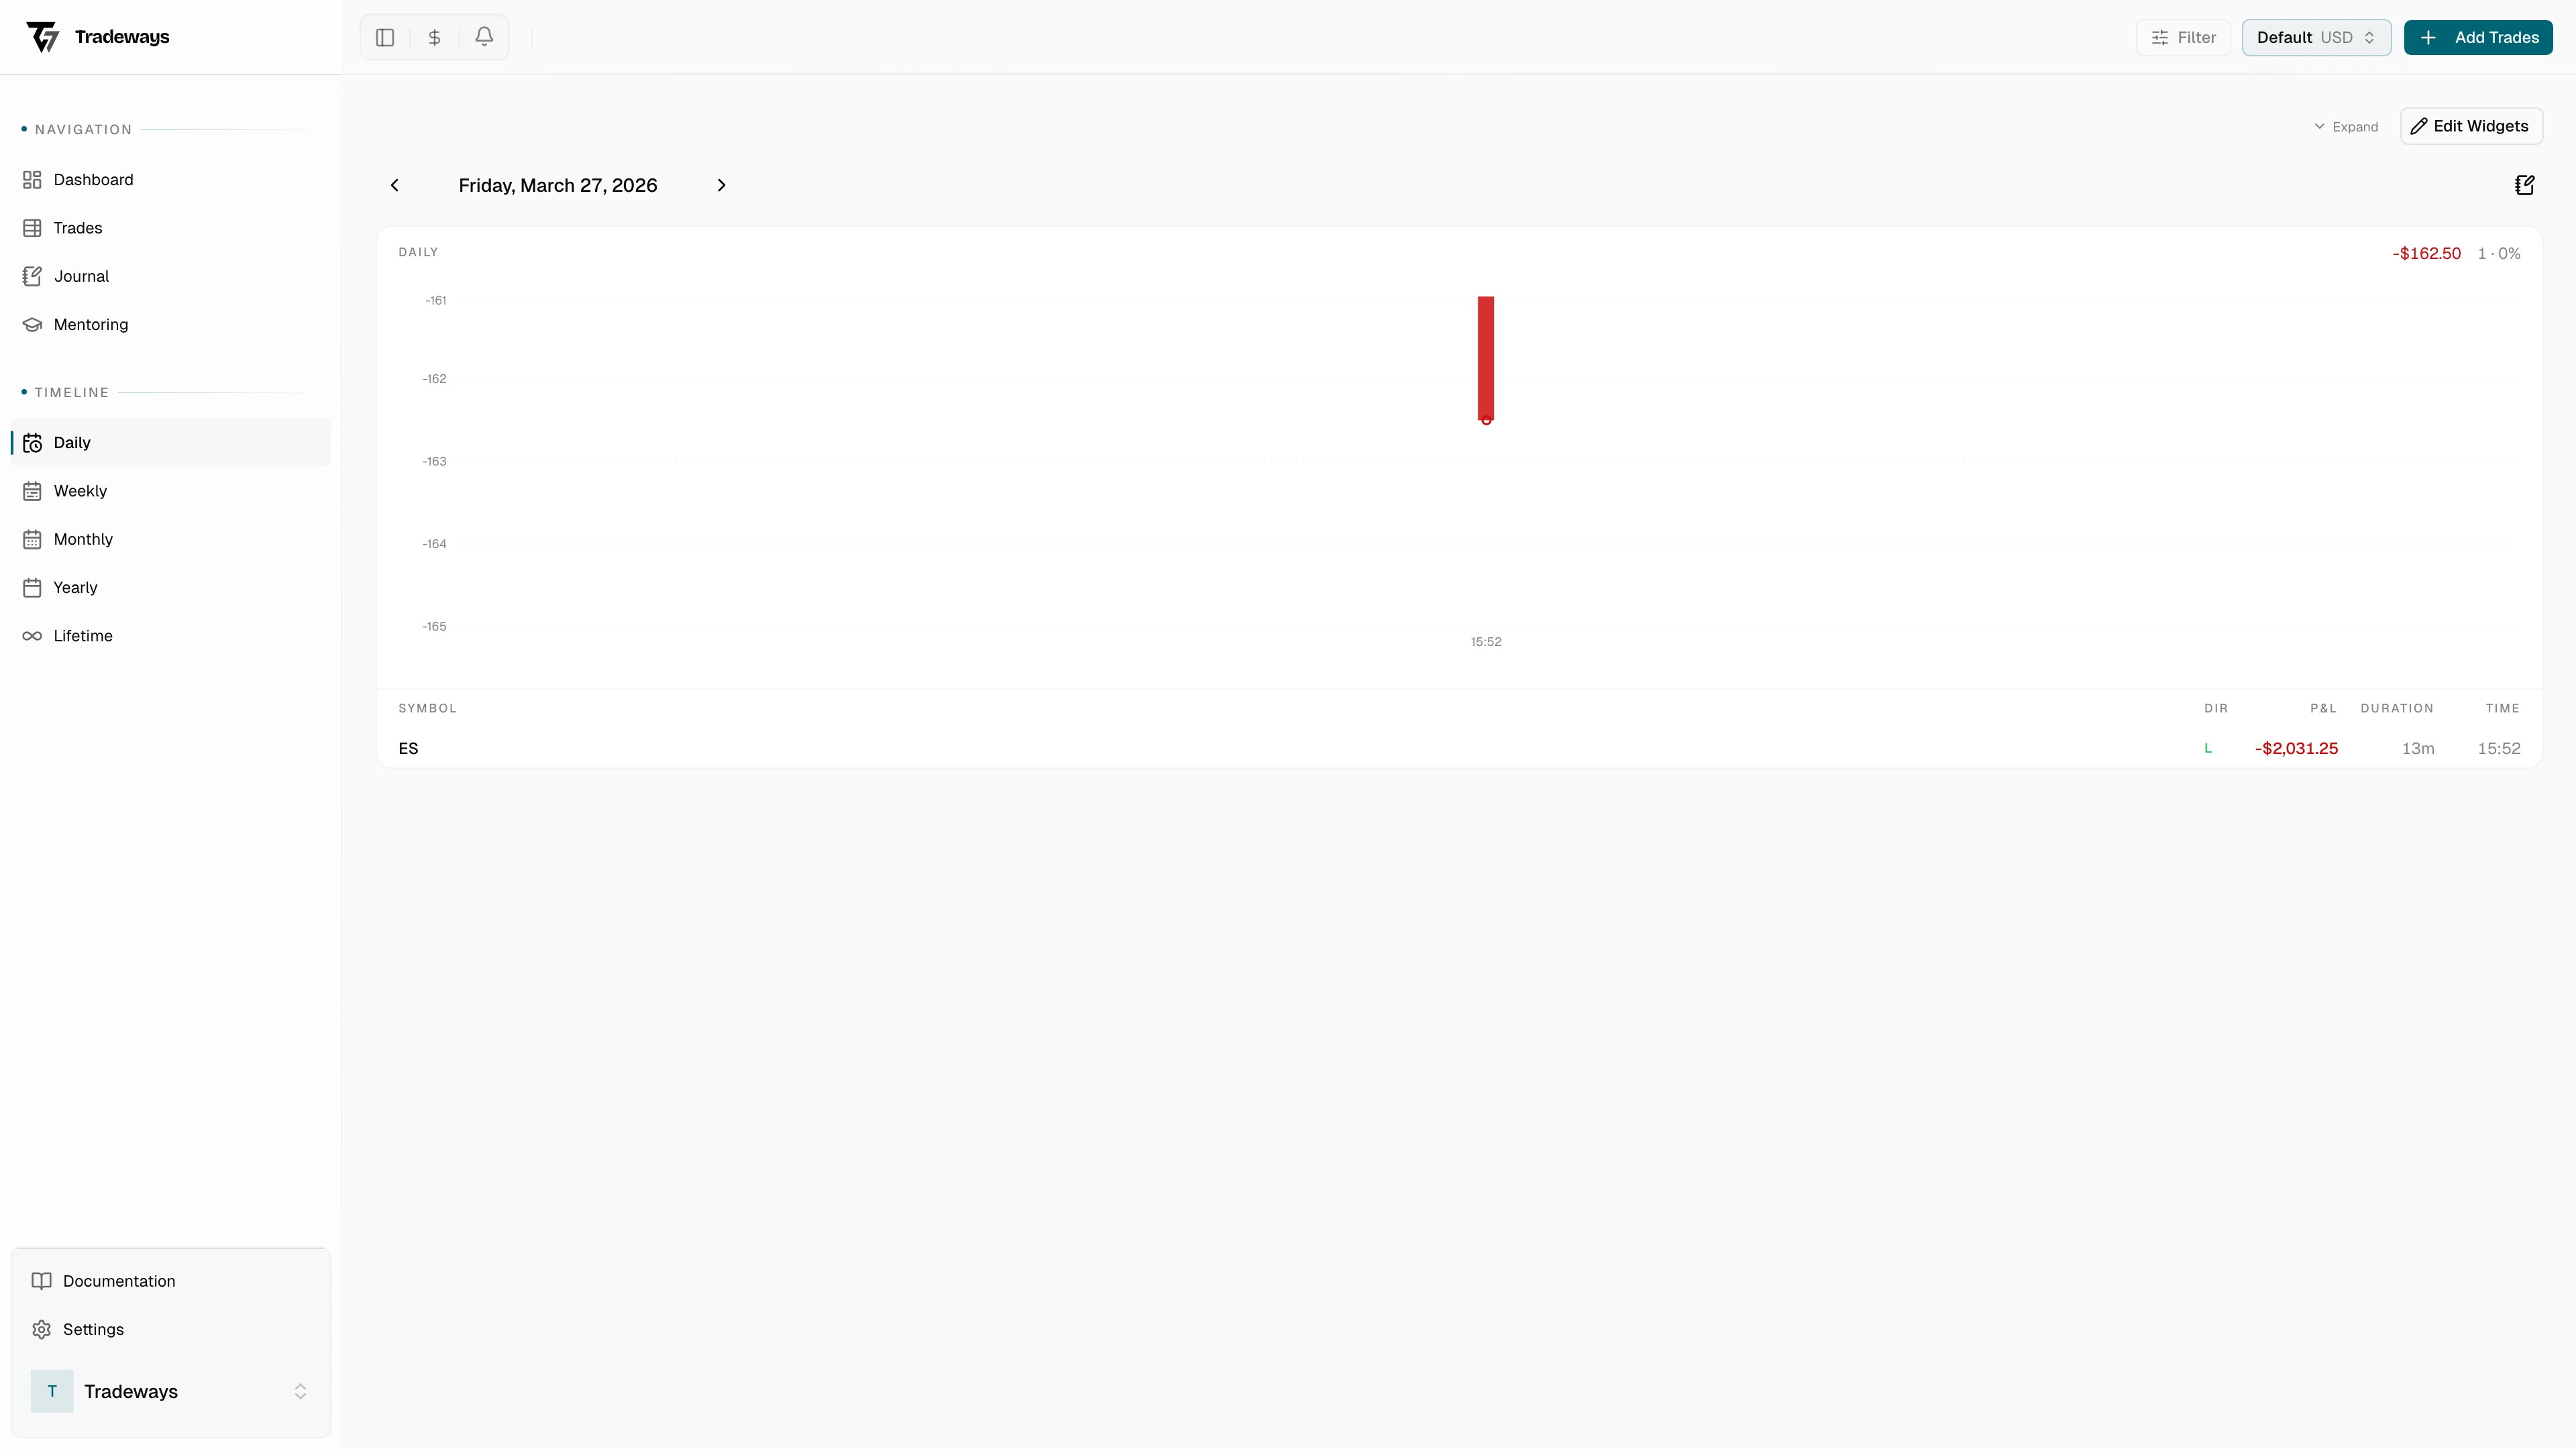
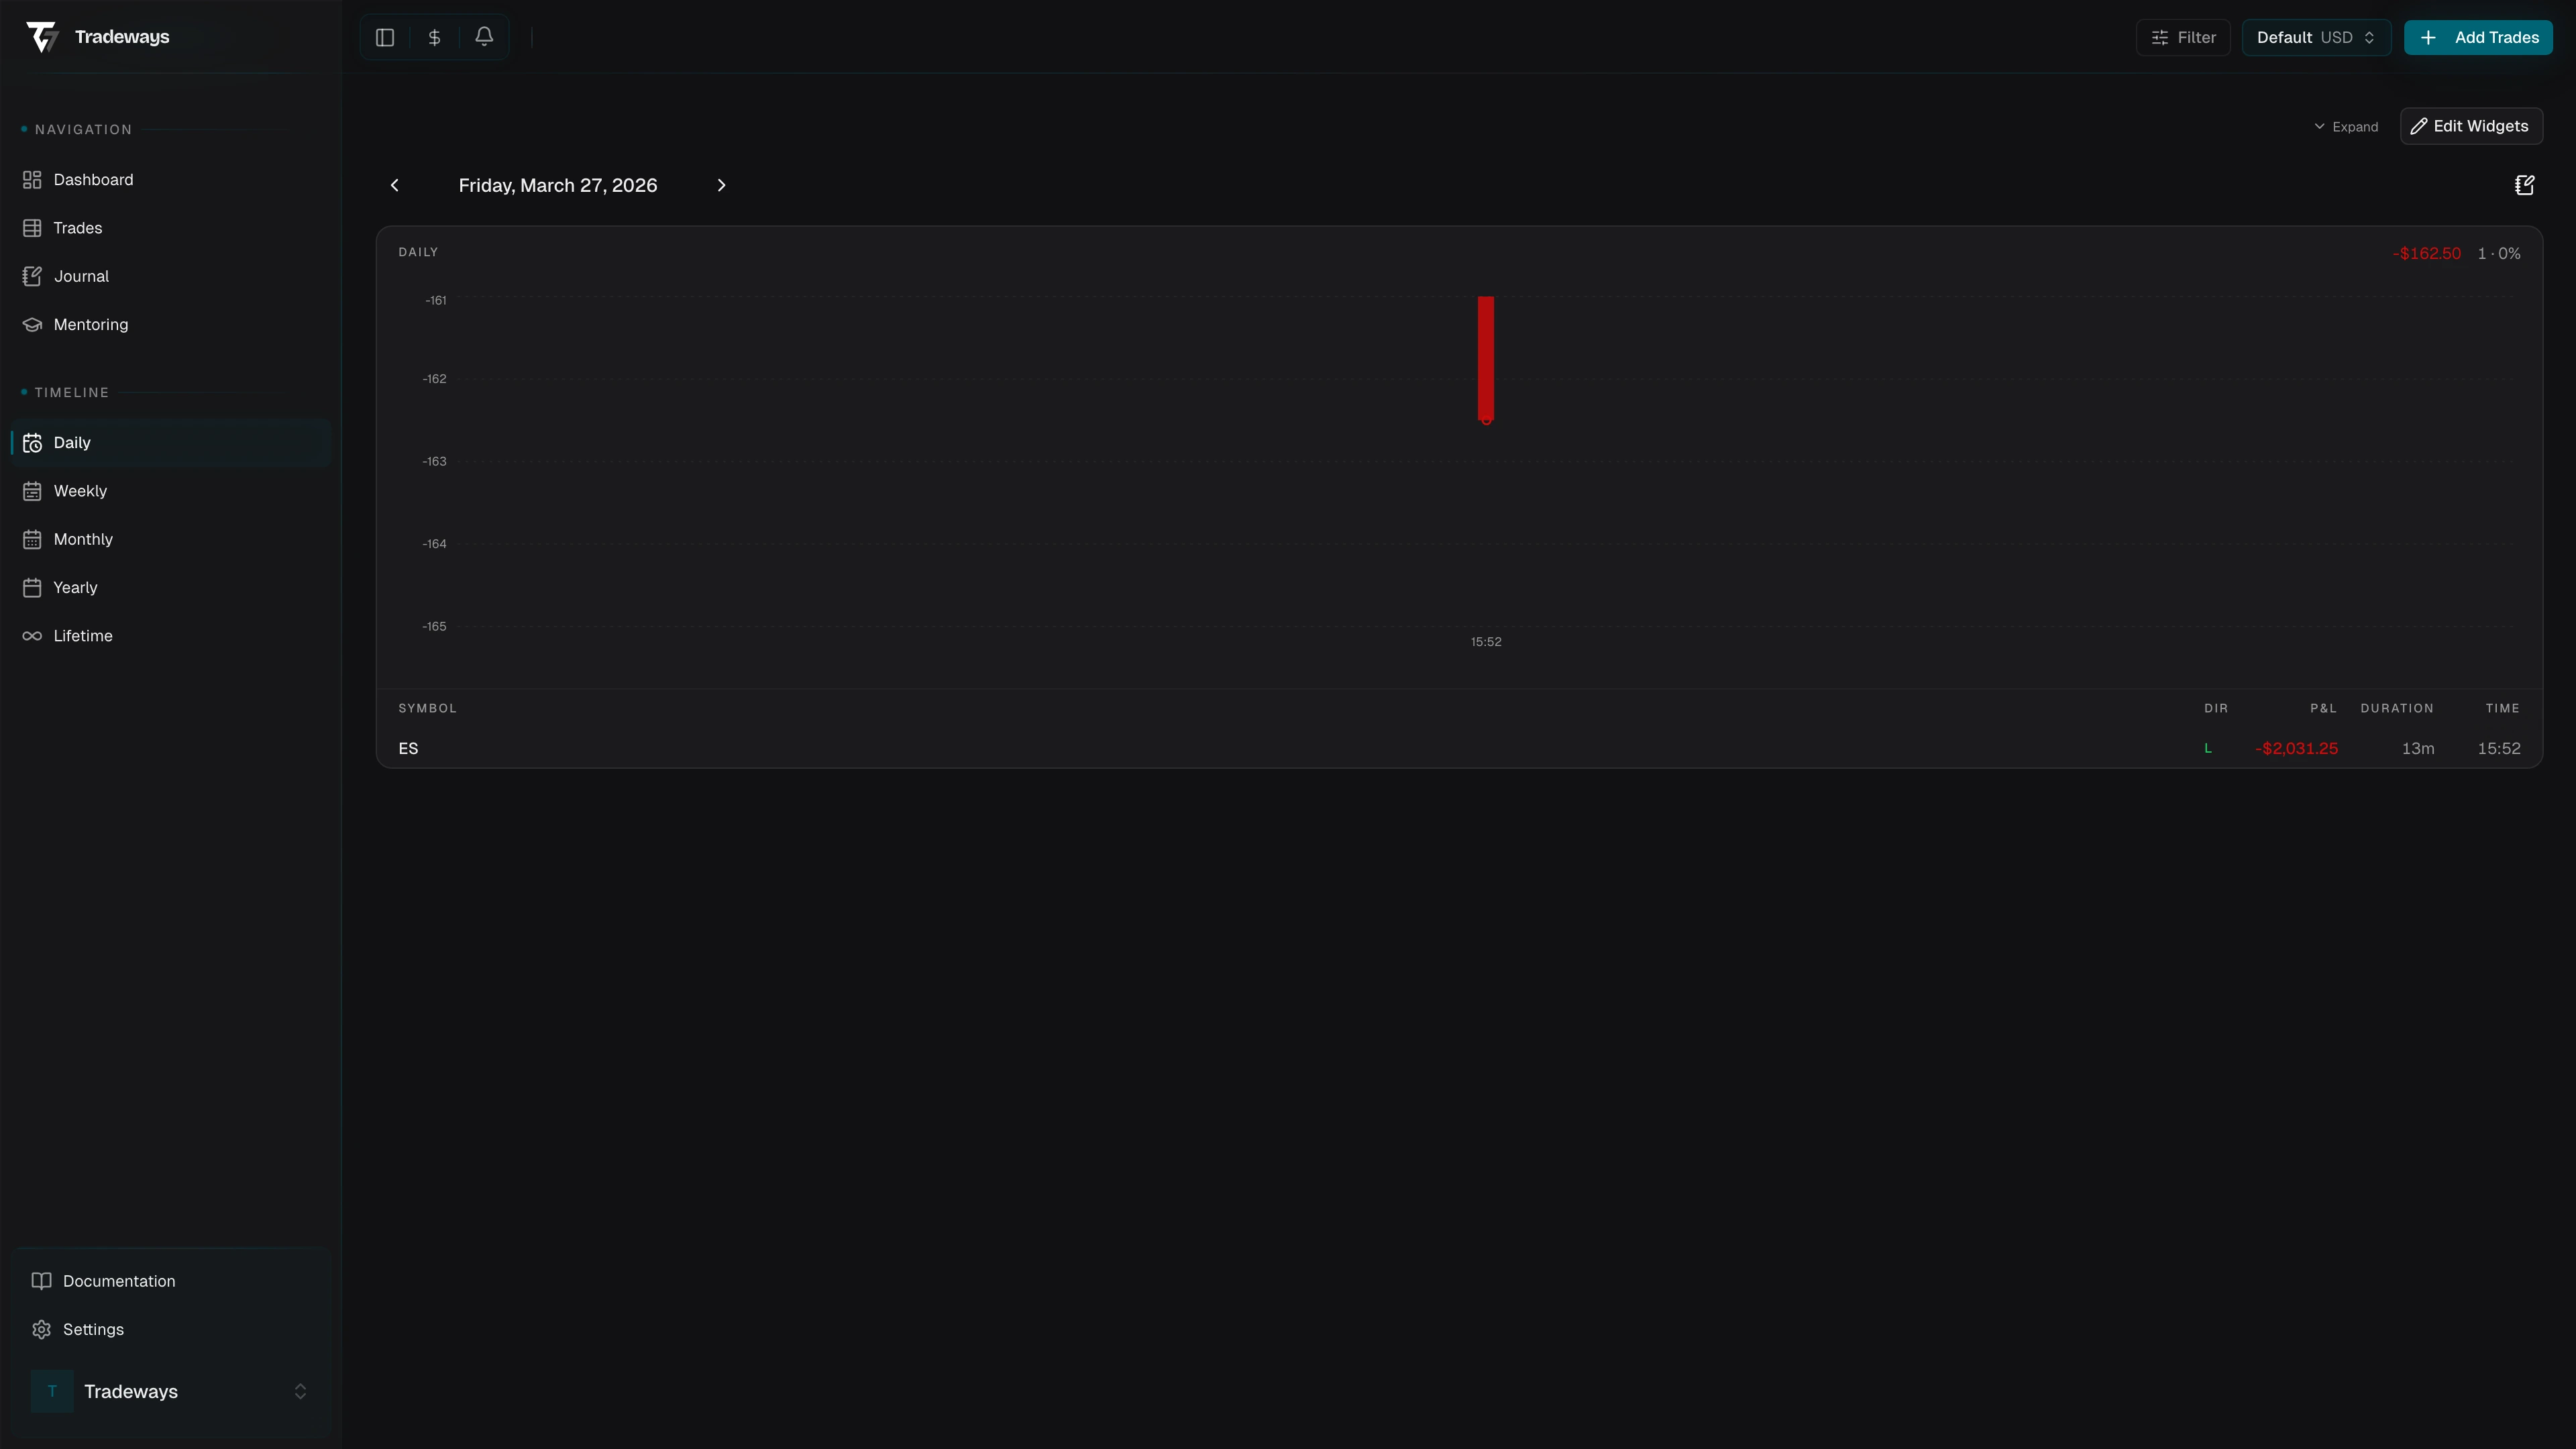
Reading the intraday chart
The chart below the header plots each closed trade against the time of day, with a cumulative curve laid over the top. Hovering a bar gives you the symbol, direction, individual P&L, running P&L, and time stamp.
This is where post-session review pays off. Look for the obvious things first: was there a single trade that paid for the day, or was the curve a steady climb? Did a winner around the open get clawed back by tilt trades after lunch? A flat morning followed by a sharp dip almost always means revenge trading. Note it in the journal before you talk yourself out of it.


Trade list
The list below the chart shows every closed trade on the day, with symbol, direction, duration, P&L, and time. Expand a row to see the individual buys and sells that made it up. That detail matters when you scaled in, scaled out, or reversed.
If you traded several symbols, the header win rate hides which instrument actually carried the day. Sort or scan the list to find the one that did, and the one that didn't.
Day journal
The journal panel opens from the header. Write the day's note here: what setup you were trading, what you'd do differently, what to flag for the weekly review. The note is attached to the date, so it surfaces again in any zoom level that drills back to this day.
See also
- Weekly view when you want to compare this day against the rest of the week
- Filter to limit which trades the daily view considers