Weekly View
One trading week zoomed out: per-day breakdown, session timeline, and weekly journal.
Weekly View
The weekly view zooms out to a single ISO week (Monday–Sunday) so you can spot which day or session drove the result, and capture a weekly review while it's fresh. Use the prev/next buttons or the calendar popover in the header to move between weeks; the label format is Week {N}, {Year}. P&L is displayed in currency or percentage, matching whatever you've set globally.

Per-day overview
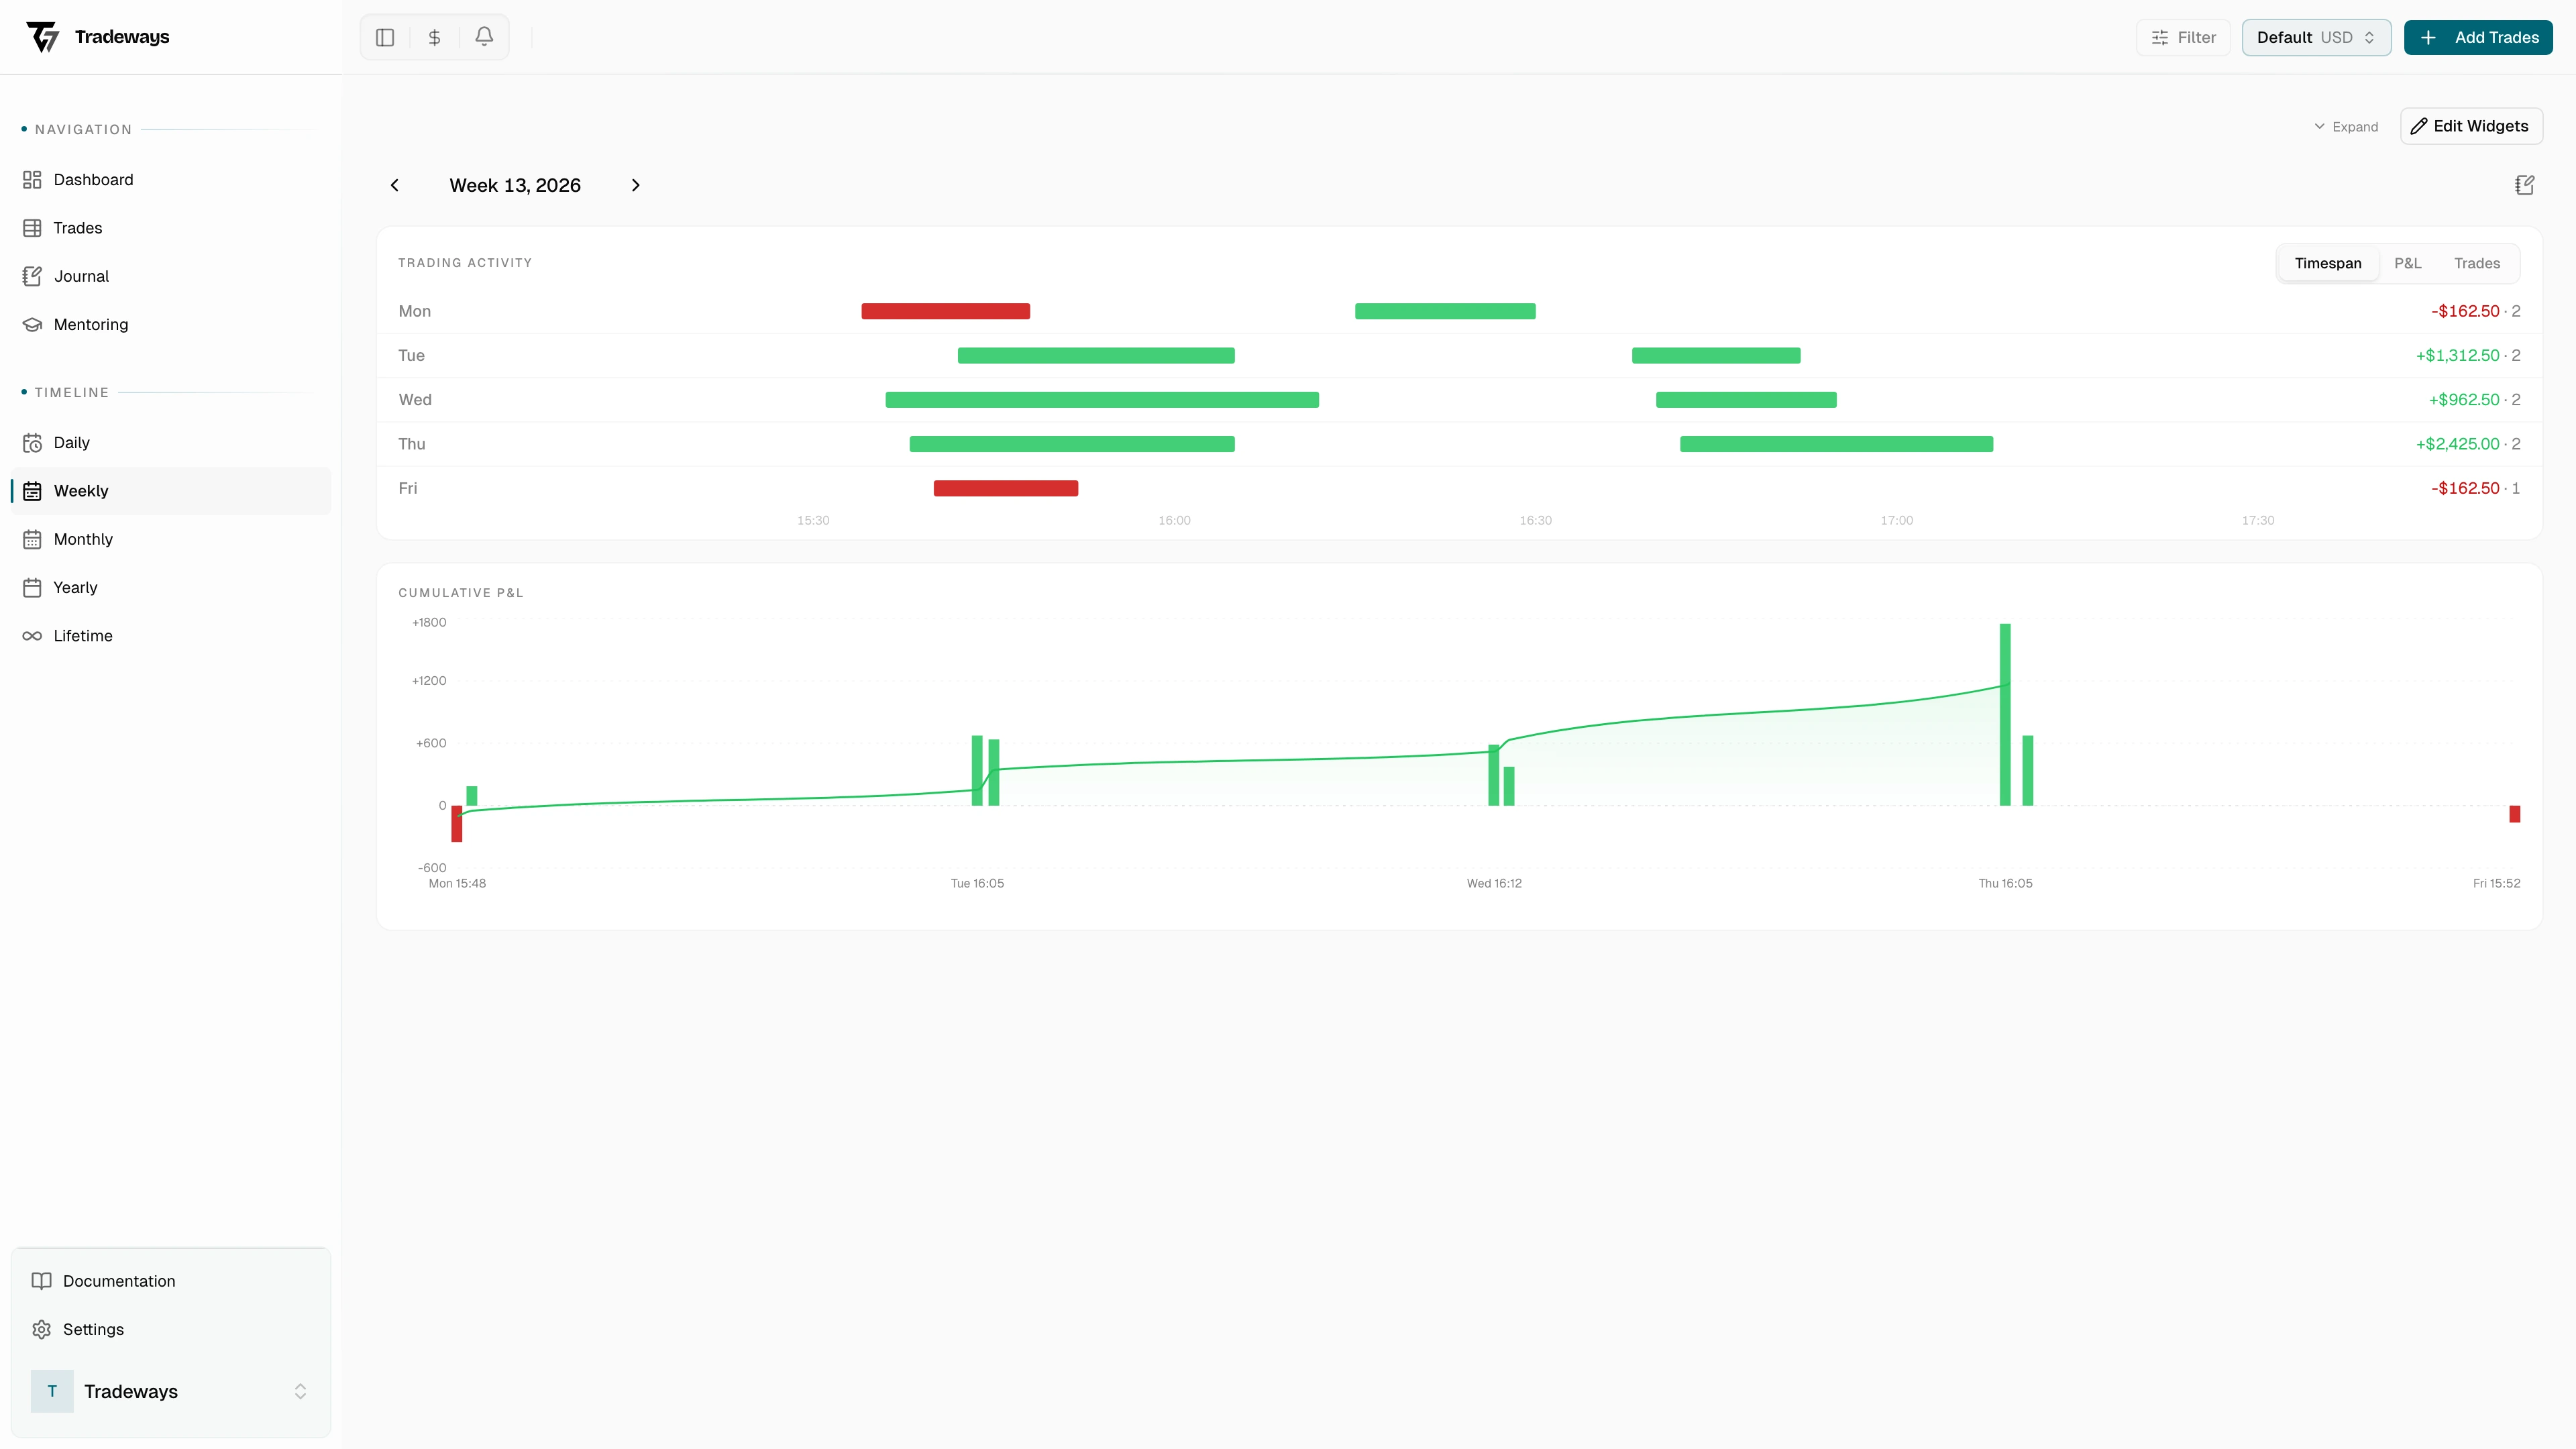
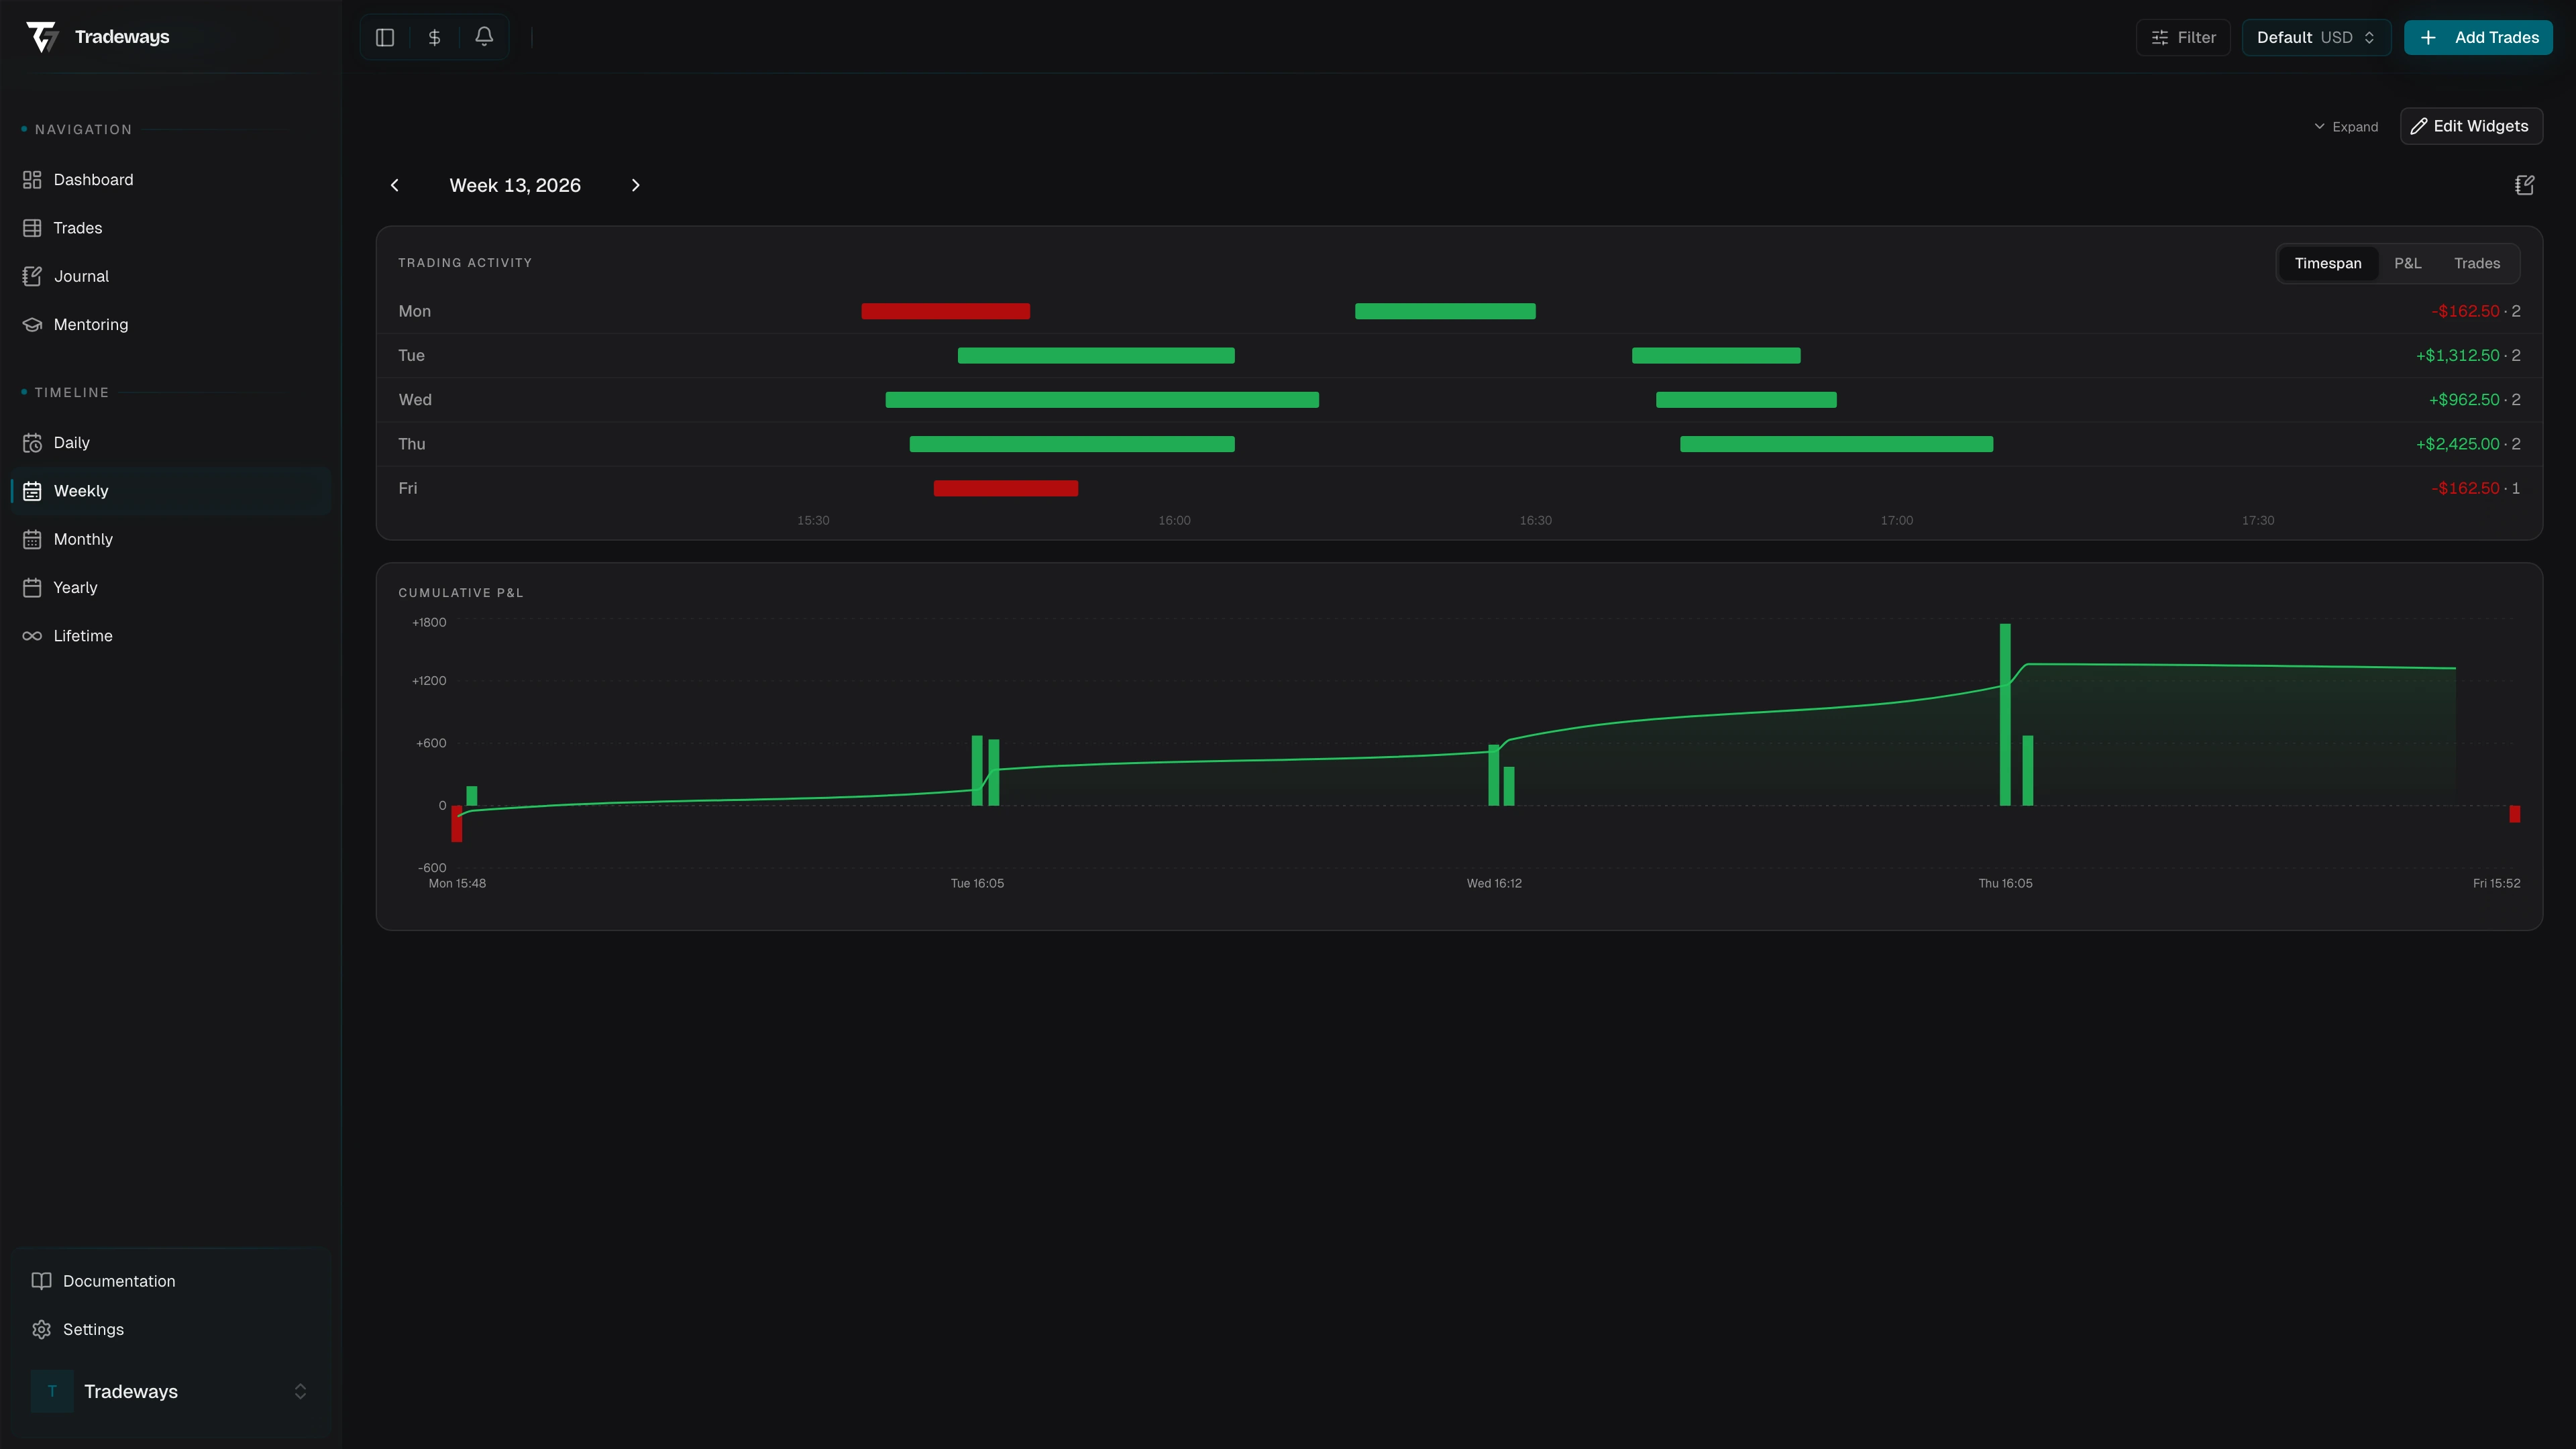
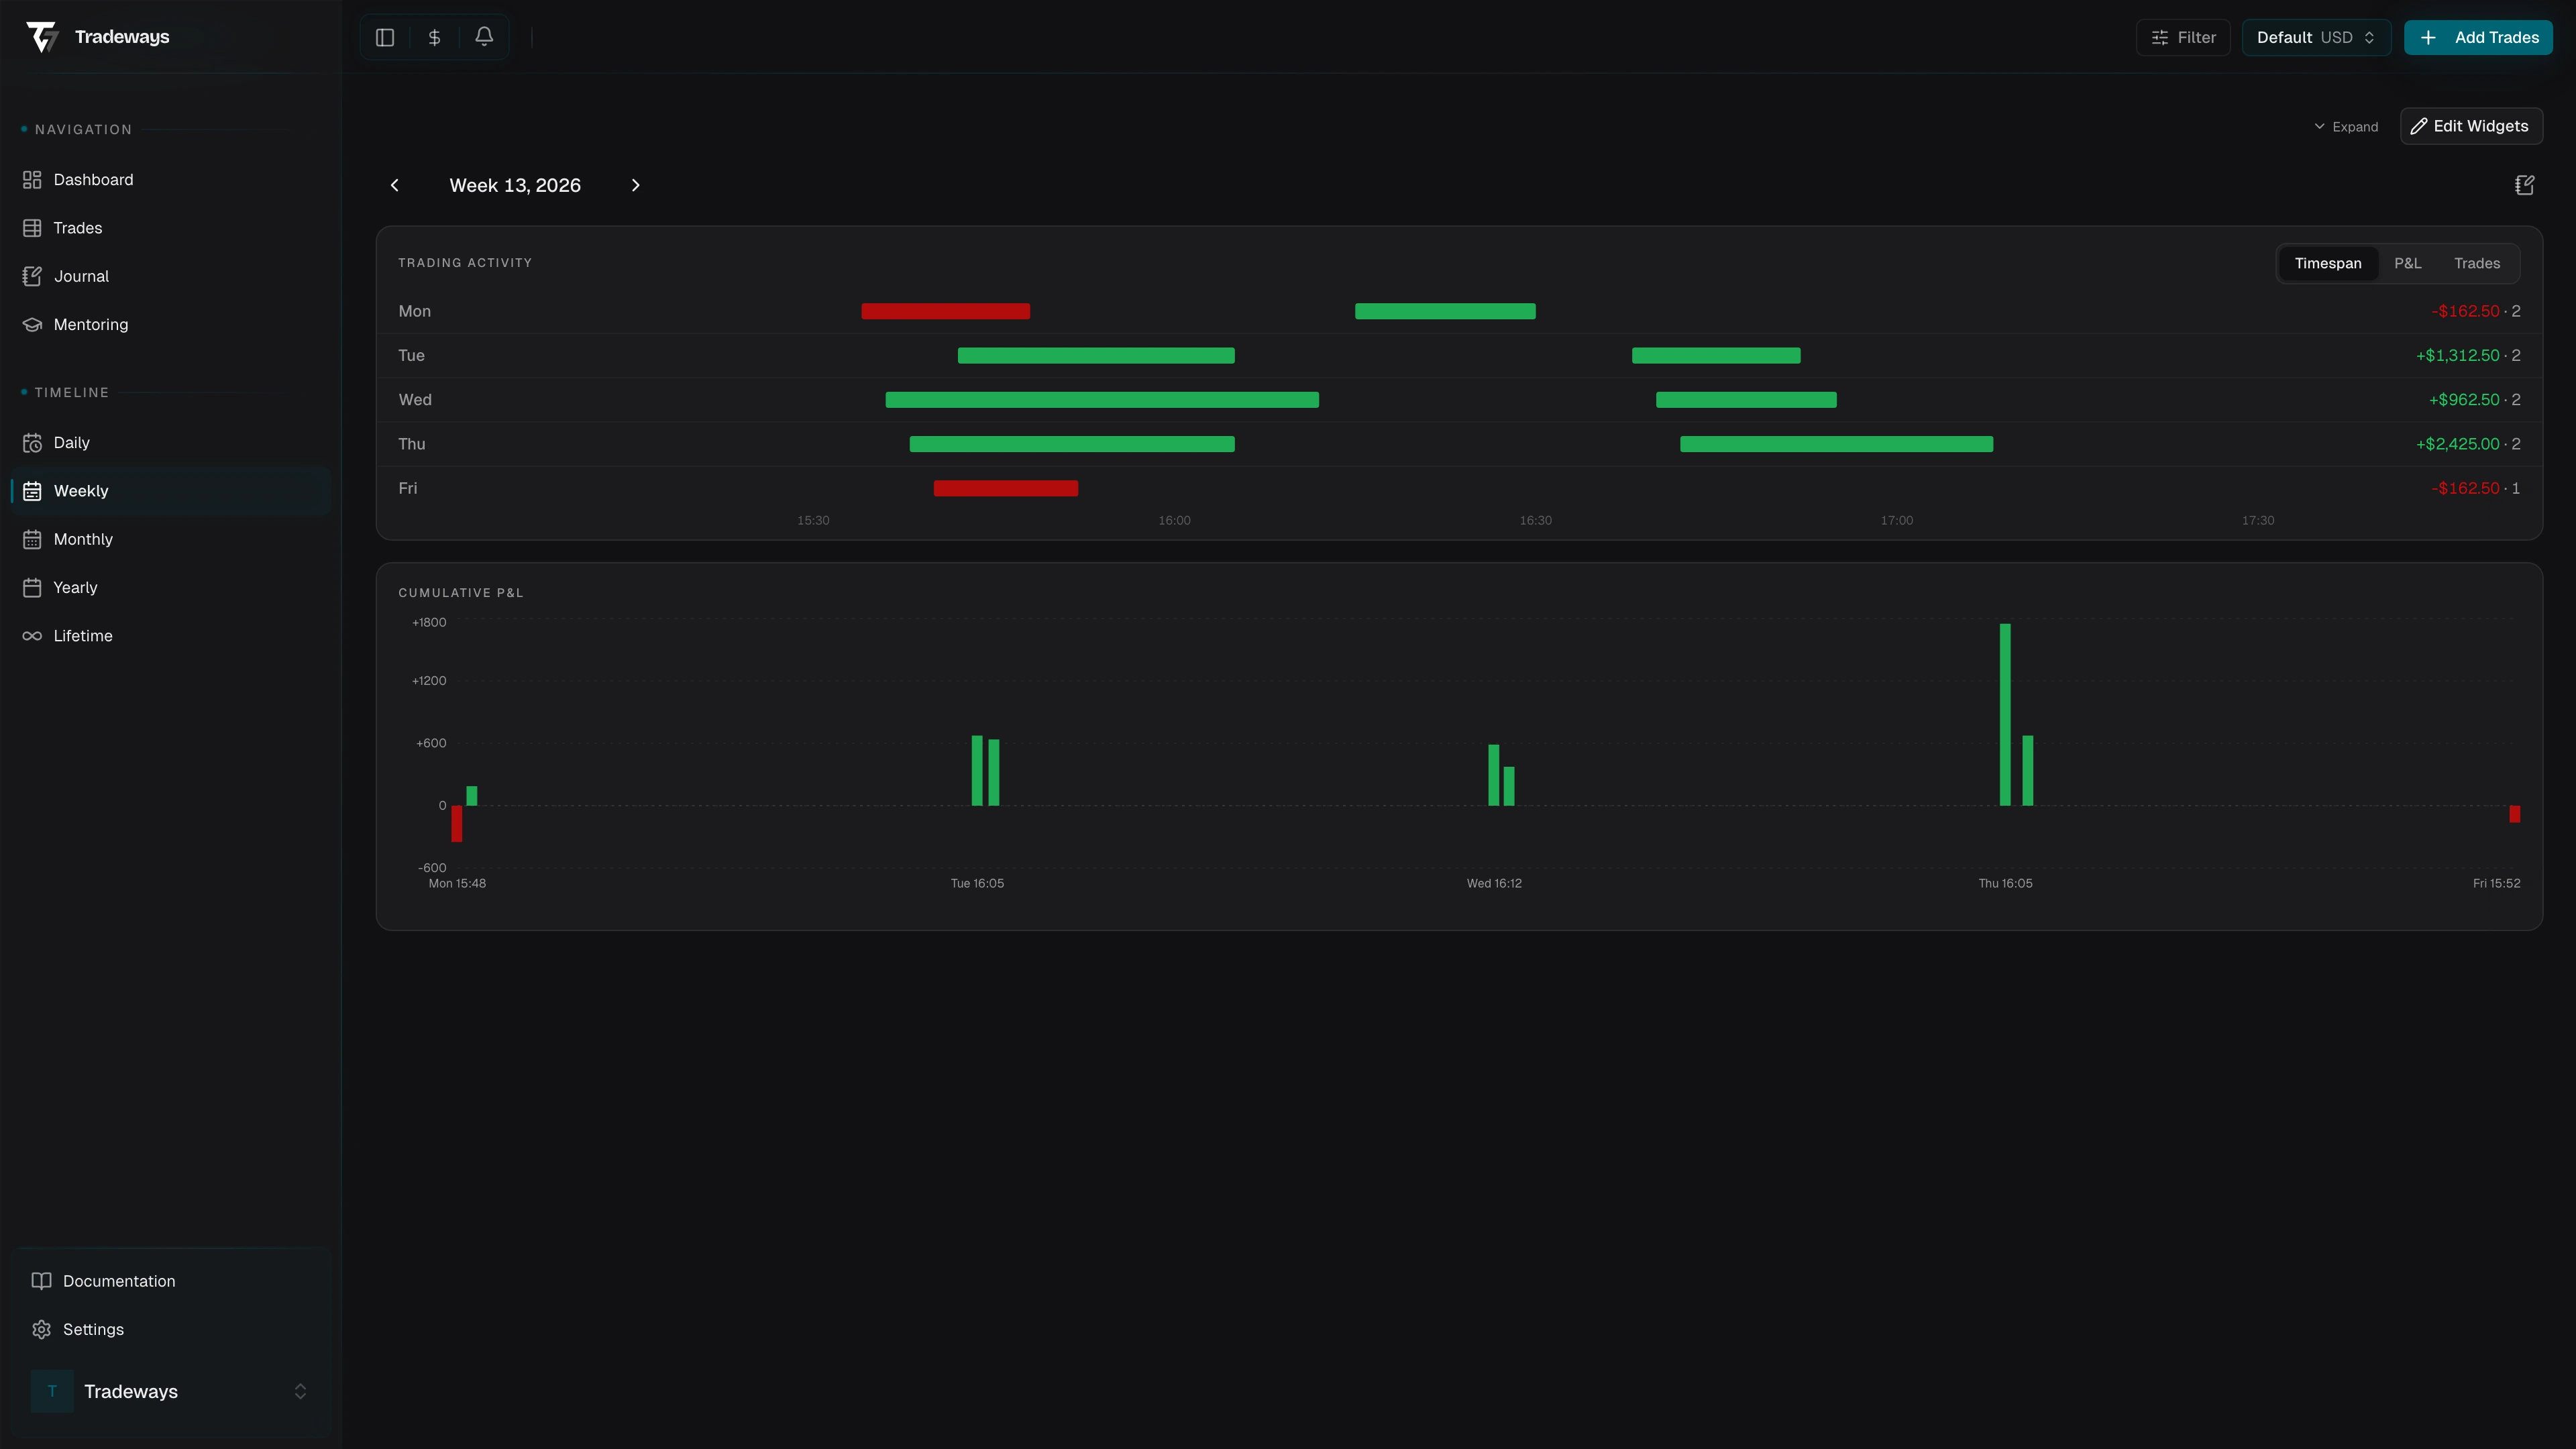
The block labeled Trading Activity lists each day of the week with its P&L and trade count. A three-way toggle in the header switches what the per-day visual shows: Timespan, P&L, or Trades.
Each mode answers a different question:
Timespan plots when each trade actually ran inside the session, with overlapping trades stacked into separate lanes. Use this mode when you want to see whether your bad days clustered around the open, lunch, or close, or whether you held positions far longer than usual.
P&L normalizes each day's bar against the largest absolute P&L of the week. If one day's bar dwarfs the others, your week's result probably hinges on a single session, which is worth a closer look in the daily view. Bars extend right for green days, left for red days.
Trades normalizes against the busiest day of the week. A spike here without matching P&L usually points to overtrading or revenge sequences; pair it with the Timespan view to see when the spike happened.
Hover any day to see a tooltip with the symbol, direction, open/close time, and P&L for each trade in that day.
Cumulative P&L for the week
Below the per-day overview, a chart shows every trade in the week as a bar with a cumulative P&L curve overlaid. The x-axis is labeled in Day HH:MM form (e.g. Wed 09:30), so you can see exactly when in the week your equity curve turned. If the curve climbs steadily and then gives back most of the gains on a single afternoon, that's the moment to investigate in the daily view.

Weekly journal
The notebook icon next to the week navigator opens (and closes) the weekly journal side panel. The icon is tinted when an entry already exists for the selected week. Treat it as a Friday-afternoon habit: what worked, what didn't, what rule got broken, and what you'll watch for next week. The entry is keyed to the ISO week, so it stays with that week regardless of when you write it.
Widgets and empty weeks
Pinned widgets at the top of the page are scoped to the selected week's date range. Configure which ones appear via Page widgets. If you select a week with no trades, the page shows No trades in week {N}, {Year} in place of the chart, which is common in slow weeks, on holidays, or when a filter is excluding everything.