Month View
Monthly calendar of daily P&L for finding the days that drove the month.
Month View
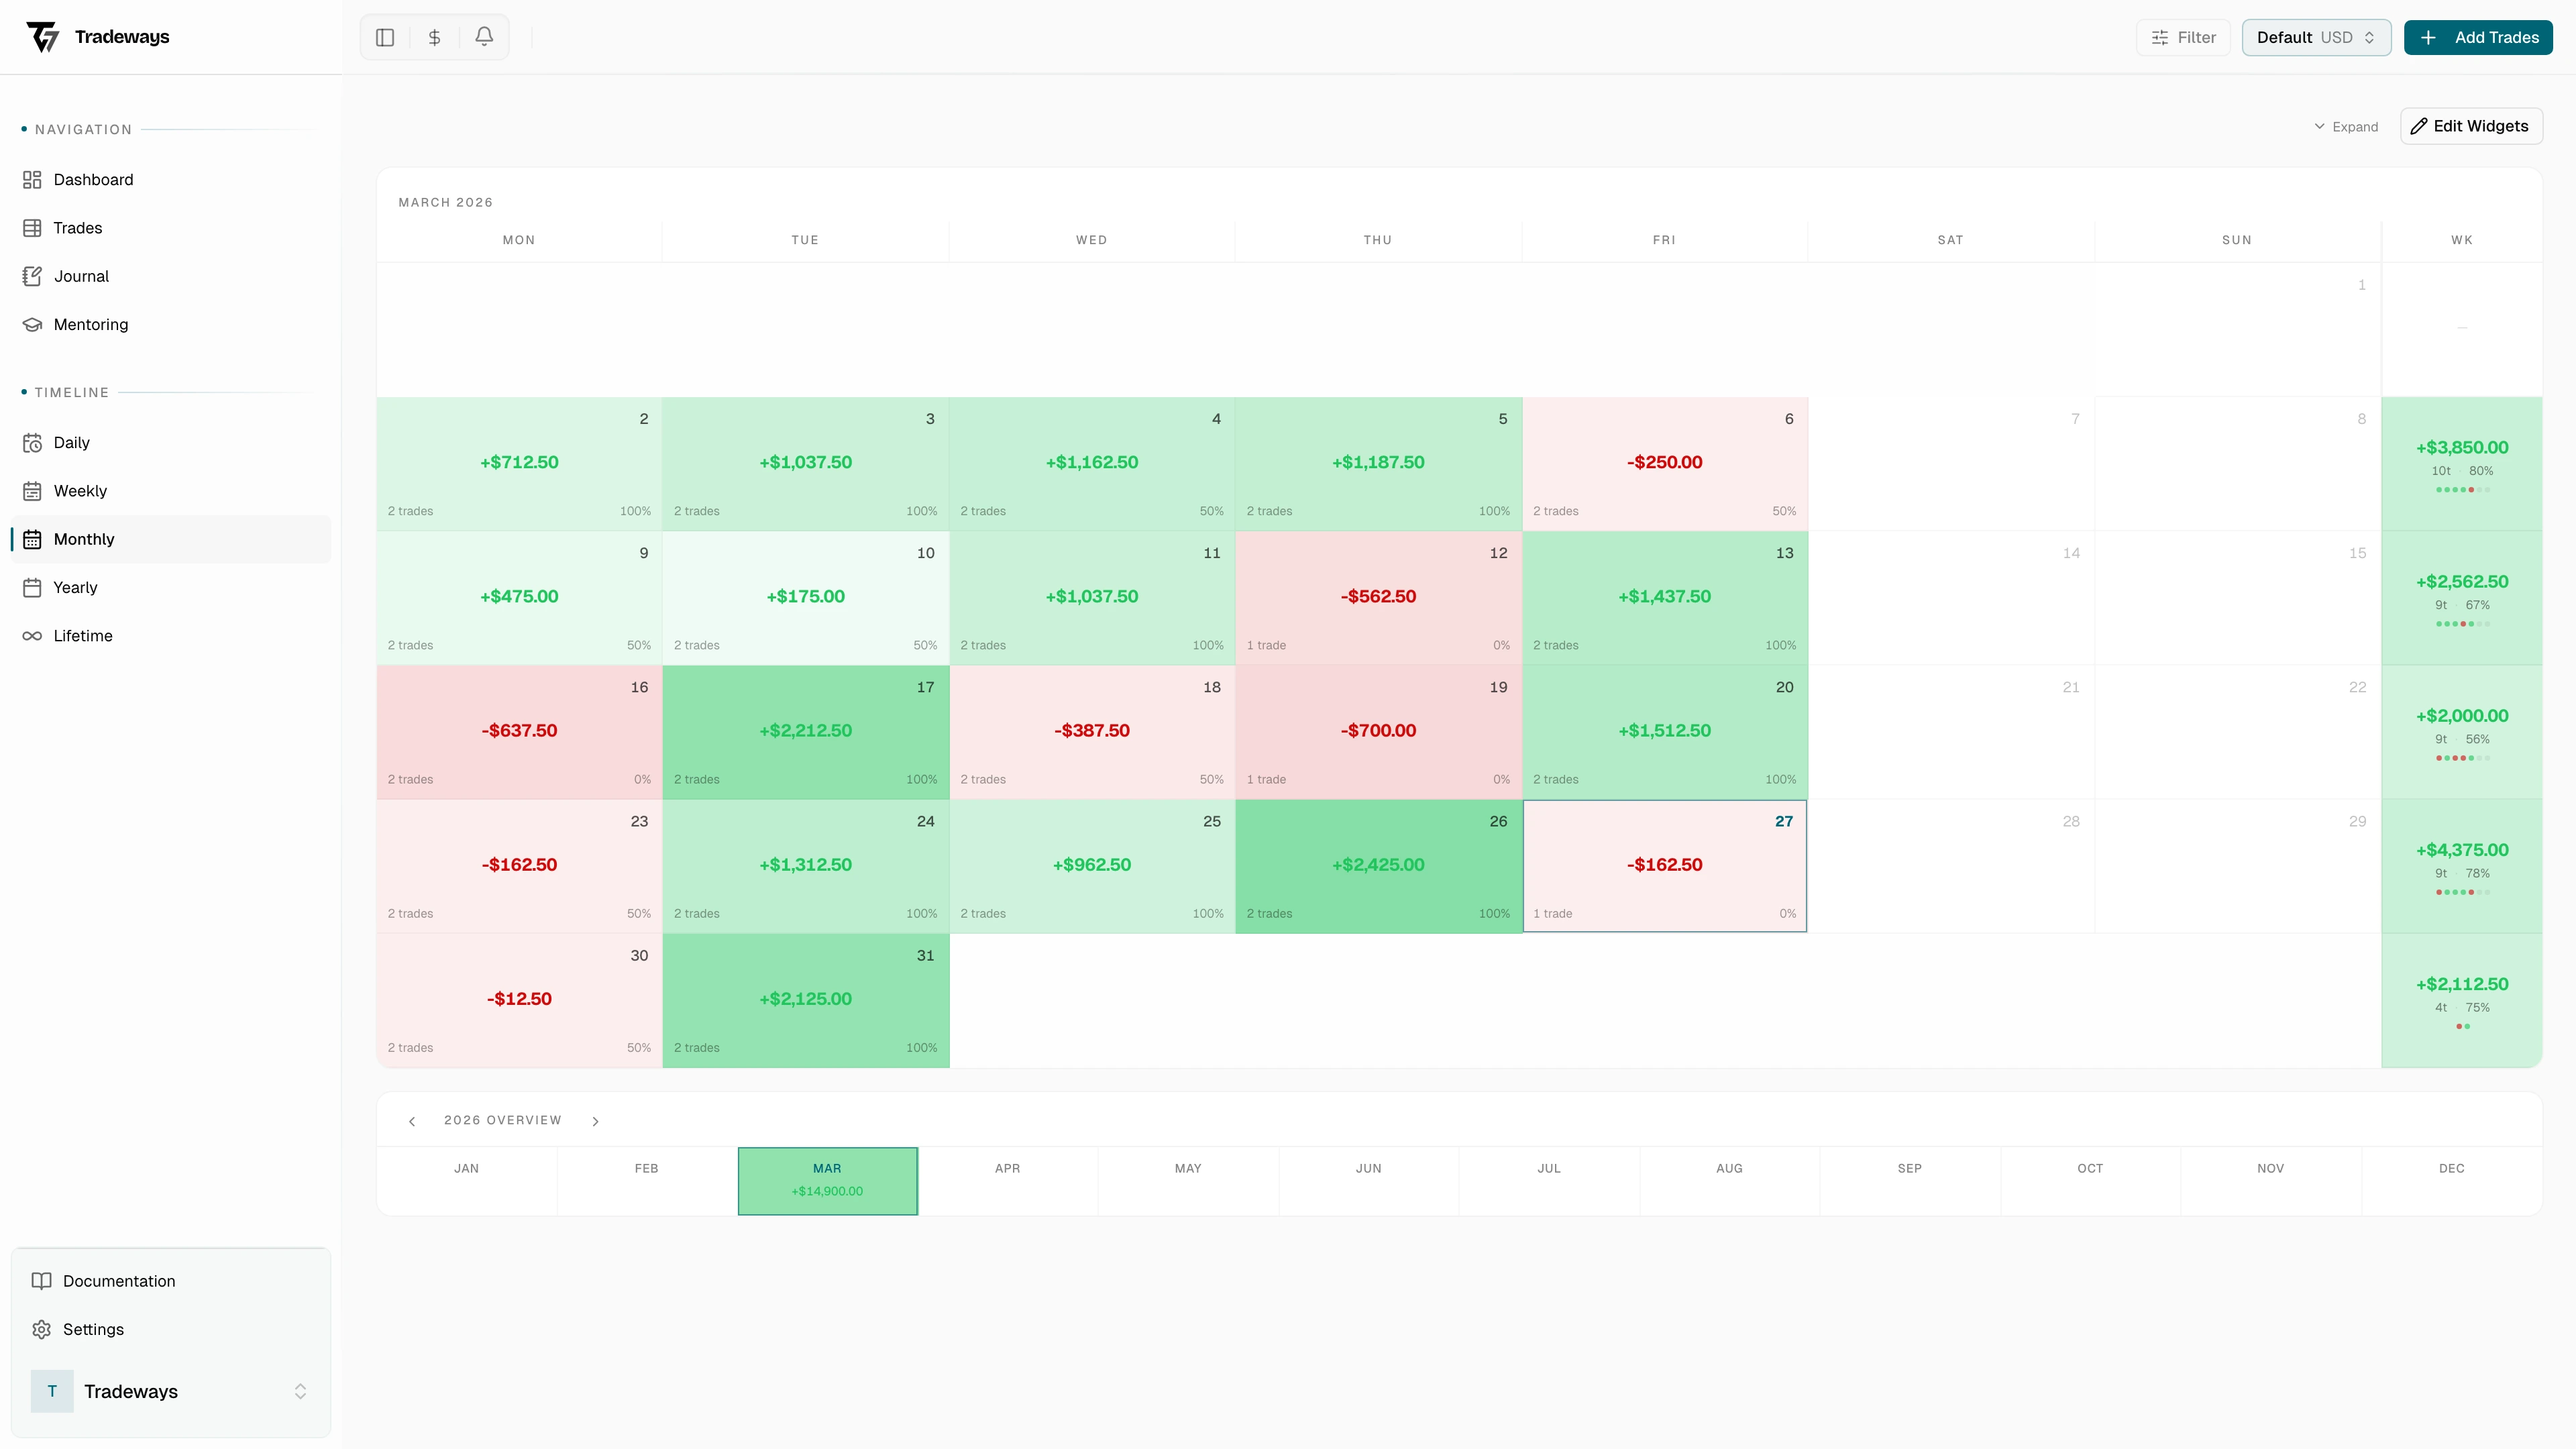
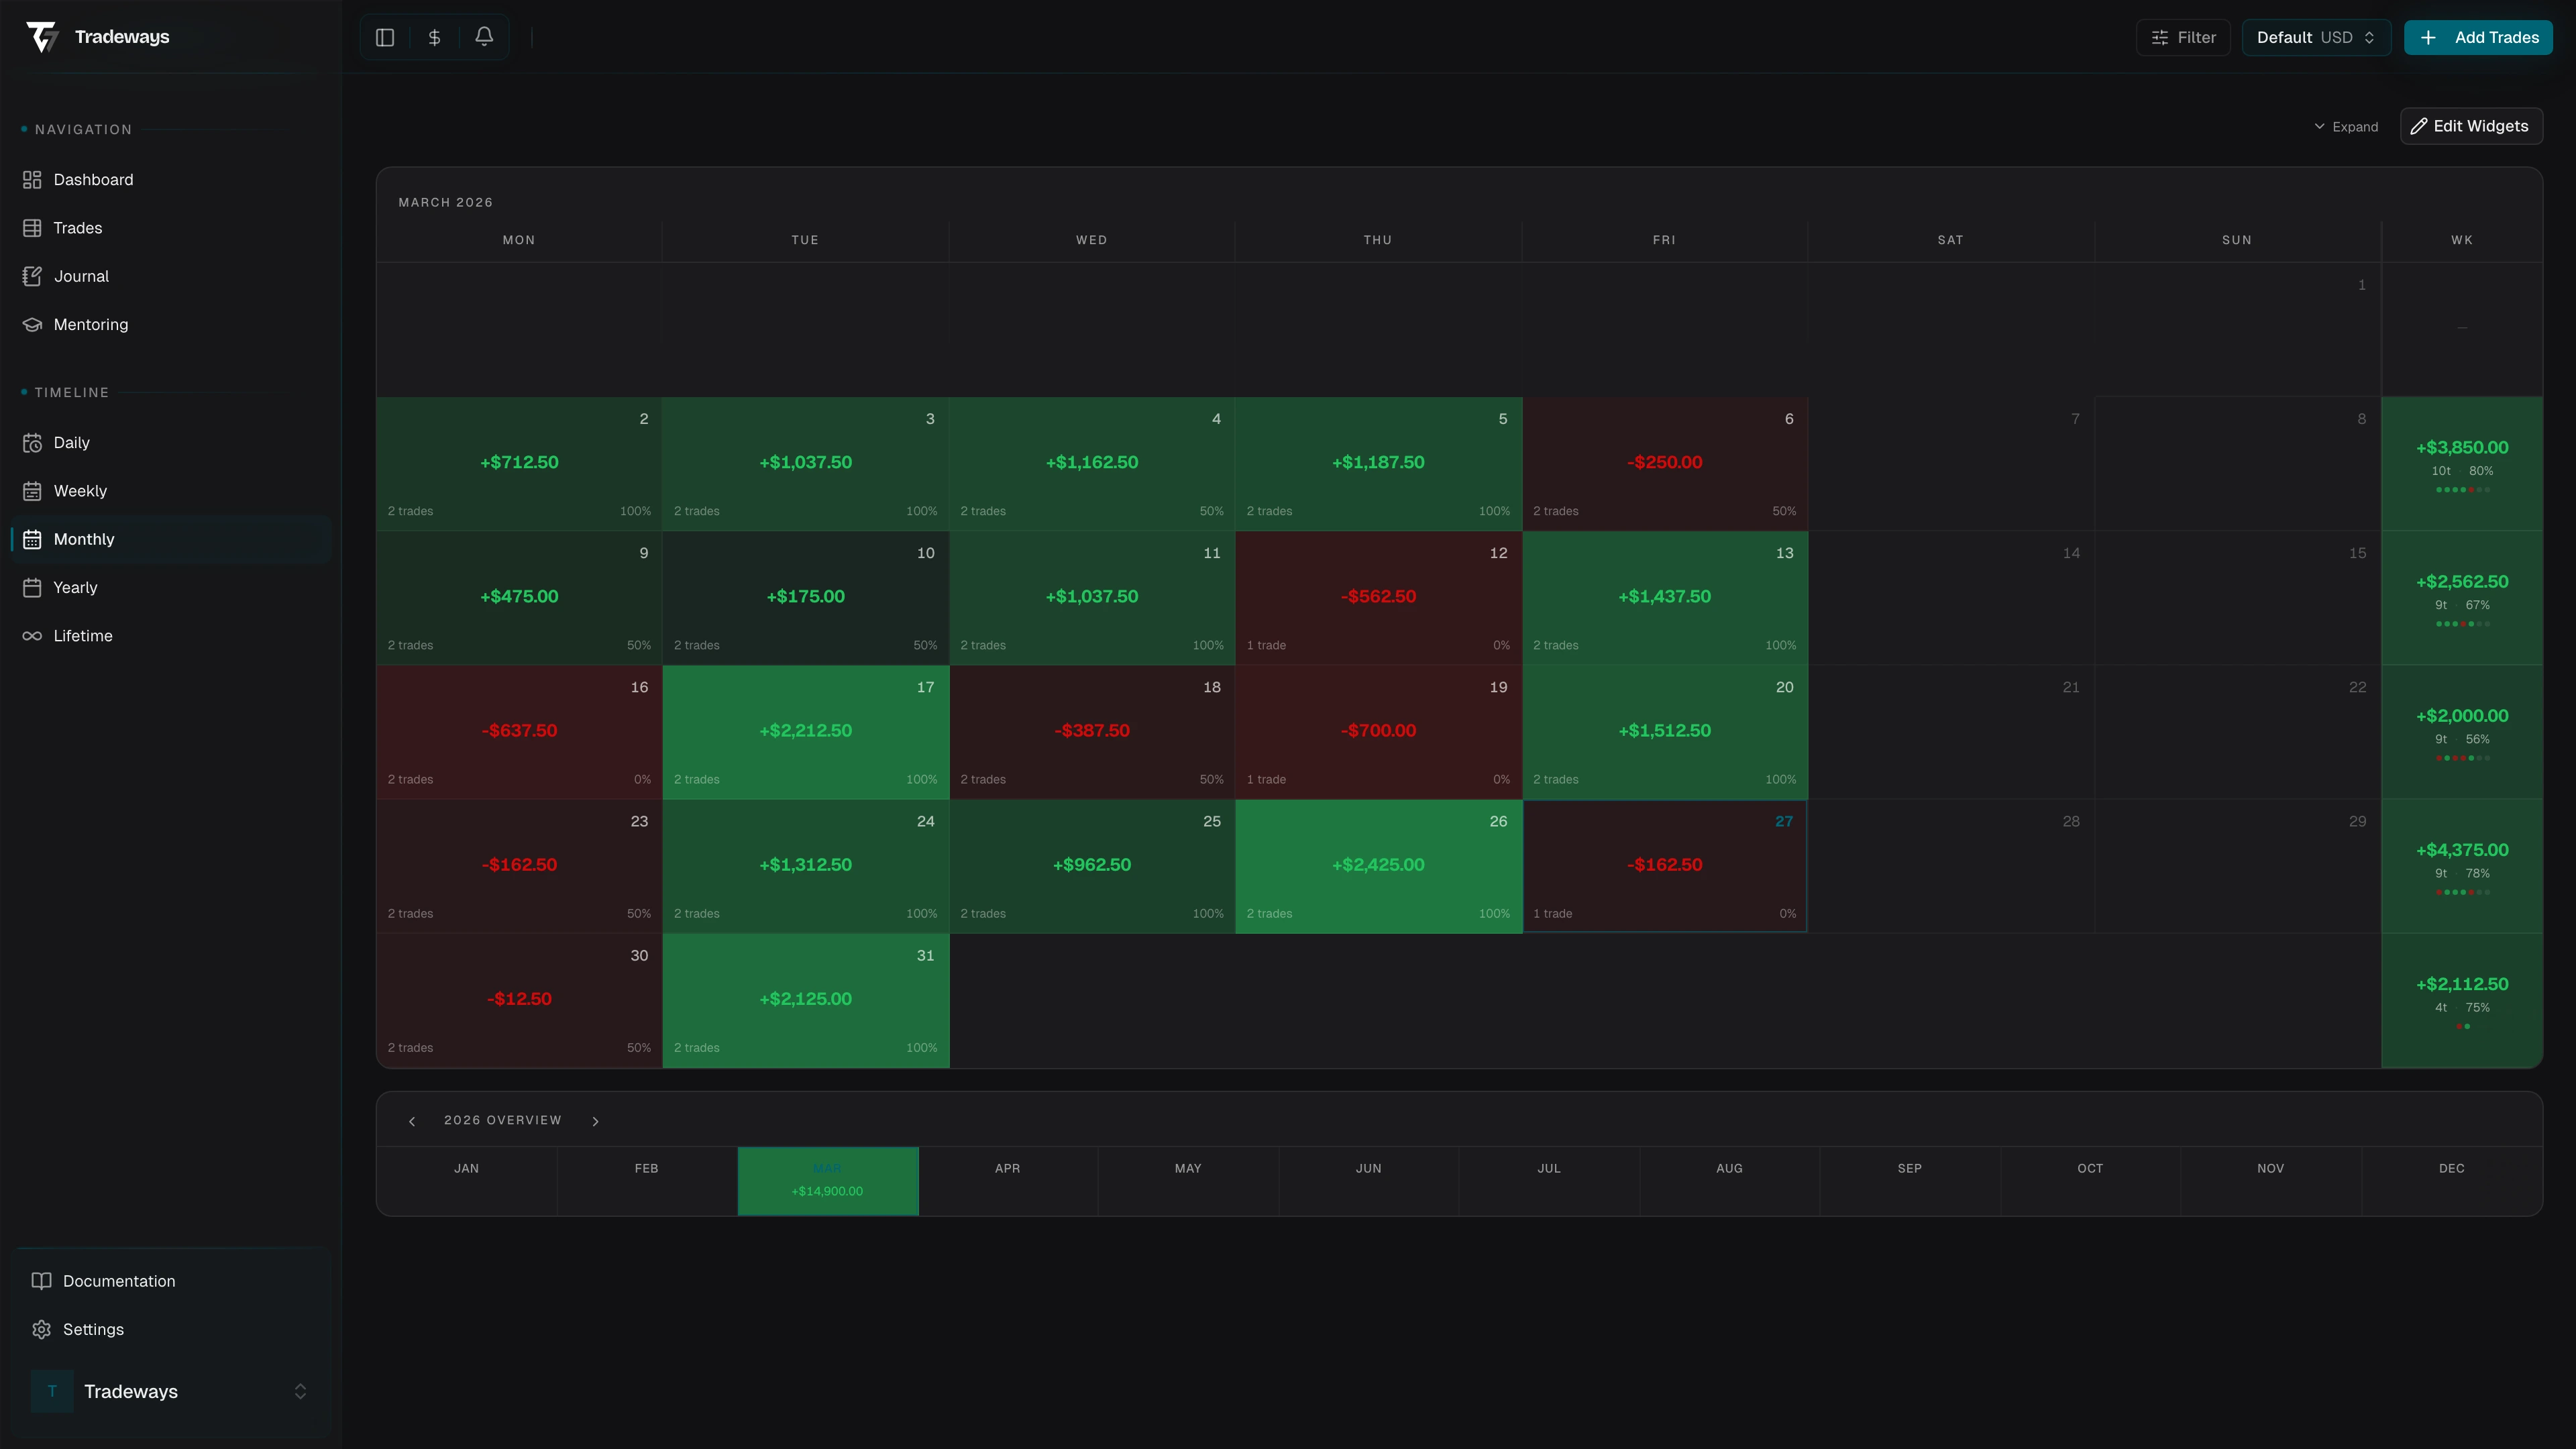
The month view lays the trading month out as a calendar. Each cell is a day, the colour is the day's P&L, and the extra column on the right is the week total. It's the right zoom for the question "which days actually built this month, and which ones bled it?" The daily view answers "how did Tuesday go".
Reading the calendar
Each day cell shows the P&L, the trade count, and the win rate. Green is a winning day, red a losing one, and the saturation scales against the best and worst day in the month. A deep red cell is the worst day relative to this month, not relative to your career.
The week column on the right sums each row, which is how you spot a week driven entirely by one day, or a week of death by a thousand cuts. Click any cell to drill into the daily view for that date.
A few patterns worth looking for:
- A handful of green cells doing all the work while the rest hover near zero. Your edge is real but concentrated, and you can probably size down on weaker setups.
- One bright red cell big enough to swallow several green ones. That's a risk management failure, not a strategy failure.
- A run of small red days in a row. Usually a sign you traded in conditions you should have skipped.
Navigating between months
The arrows in the header step month by month. The row of months above the calendar lets you jump anywhere in the current year, and the year arrows on the sides move forward or back a year at a time.
All values are shown in the account currency.
See also
- Daily view to drill into a specific day
- Filter to limit which trades the calendar considers