Dashboard
Customizable multi-dashboard system with drag-and-drop widgets, templates, and per-account memory.
Dashboard
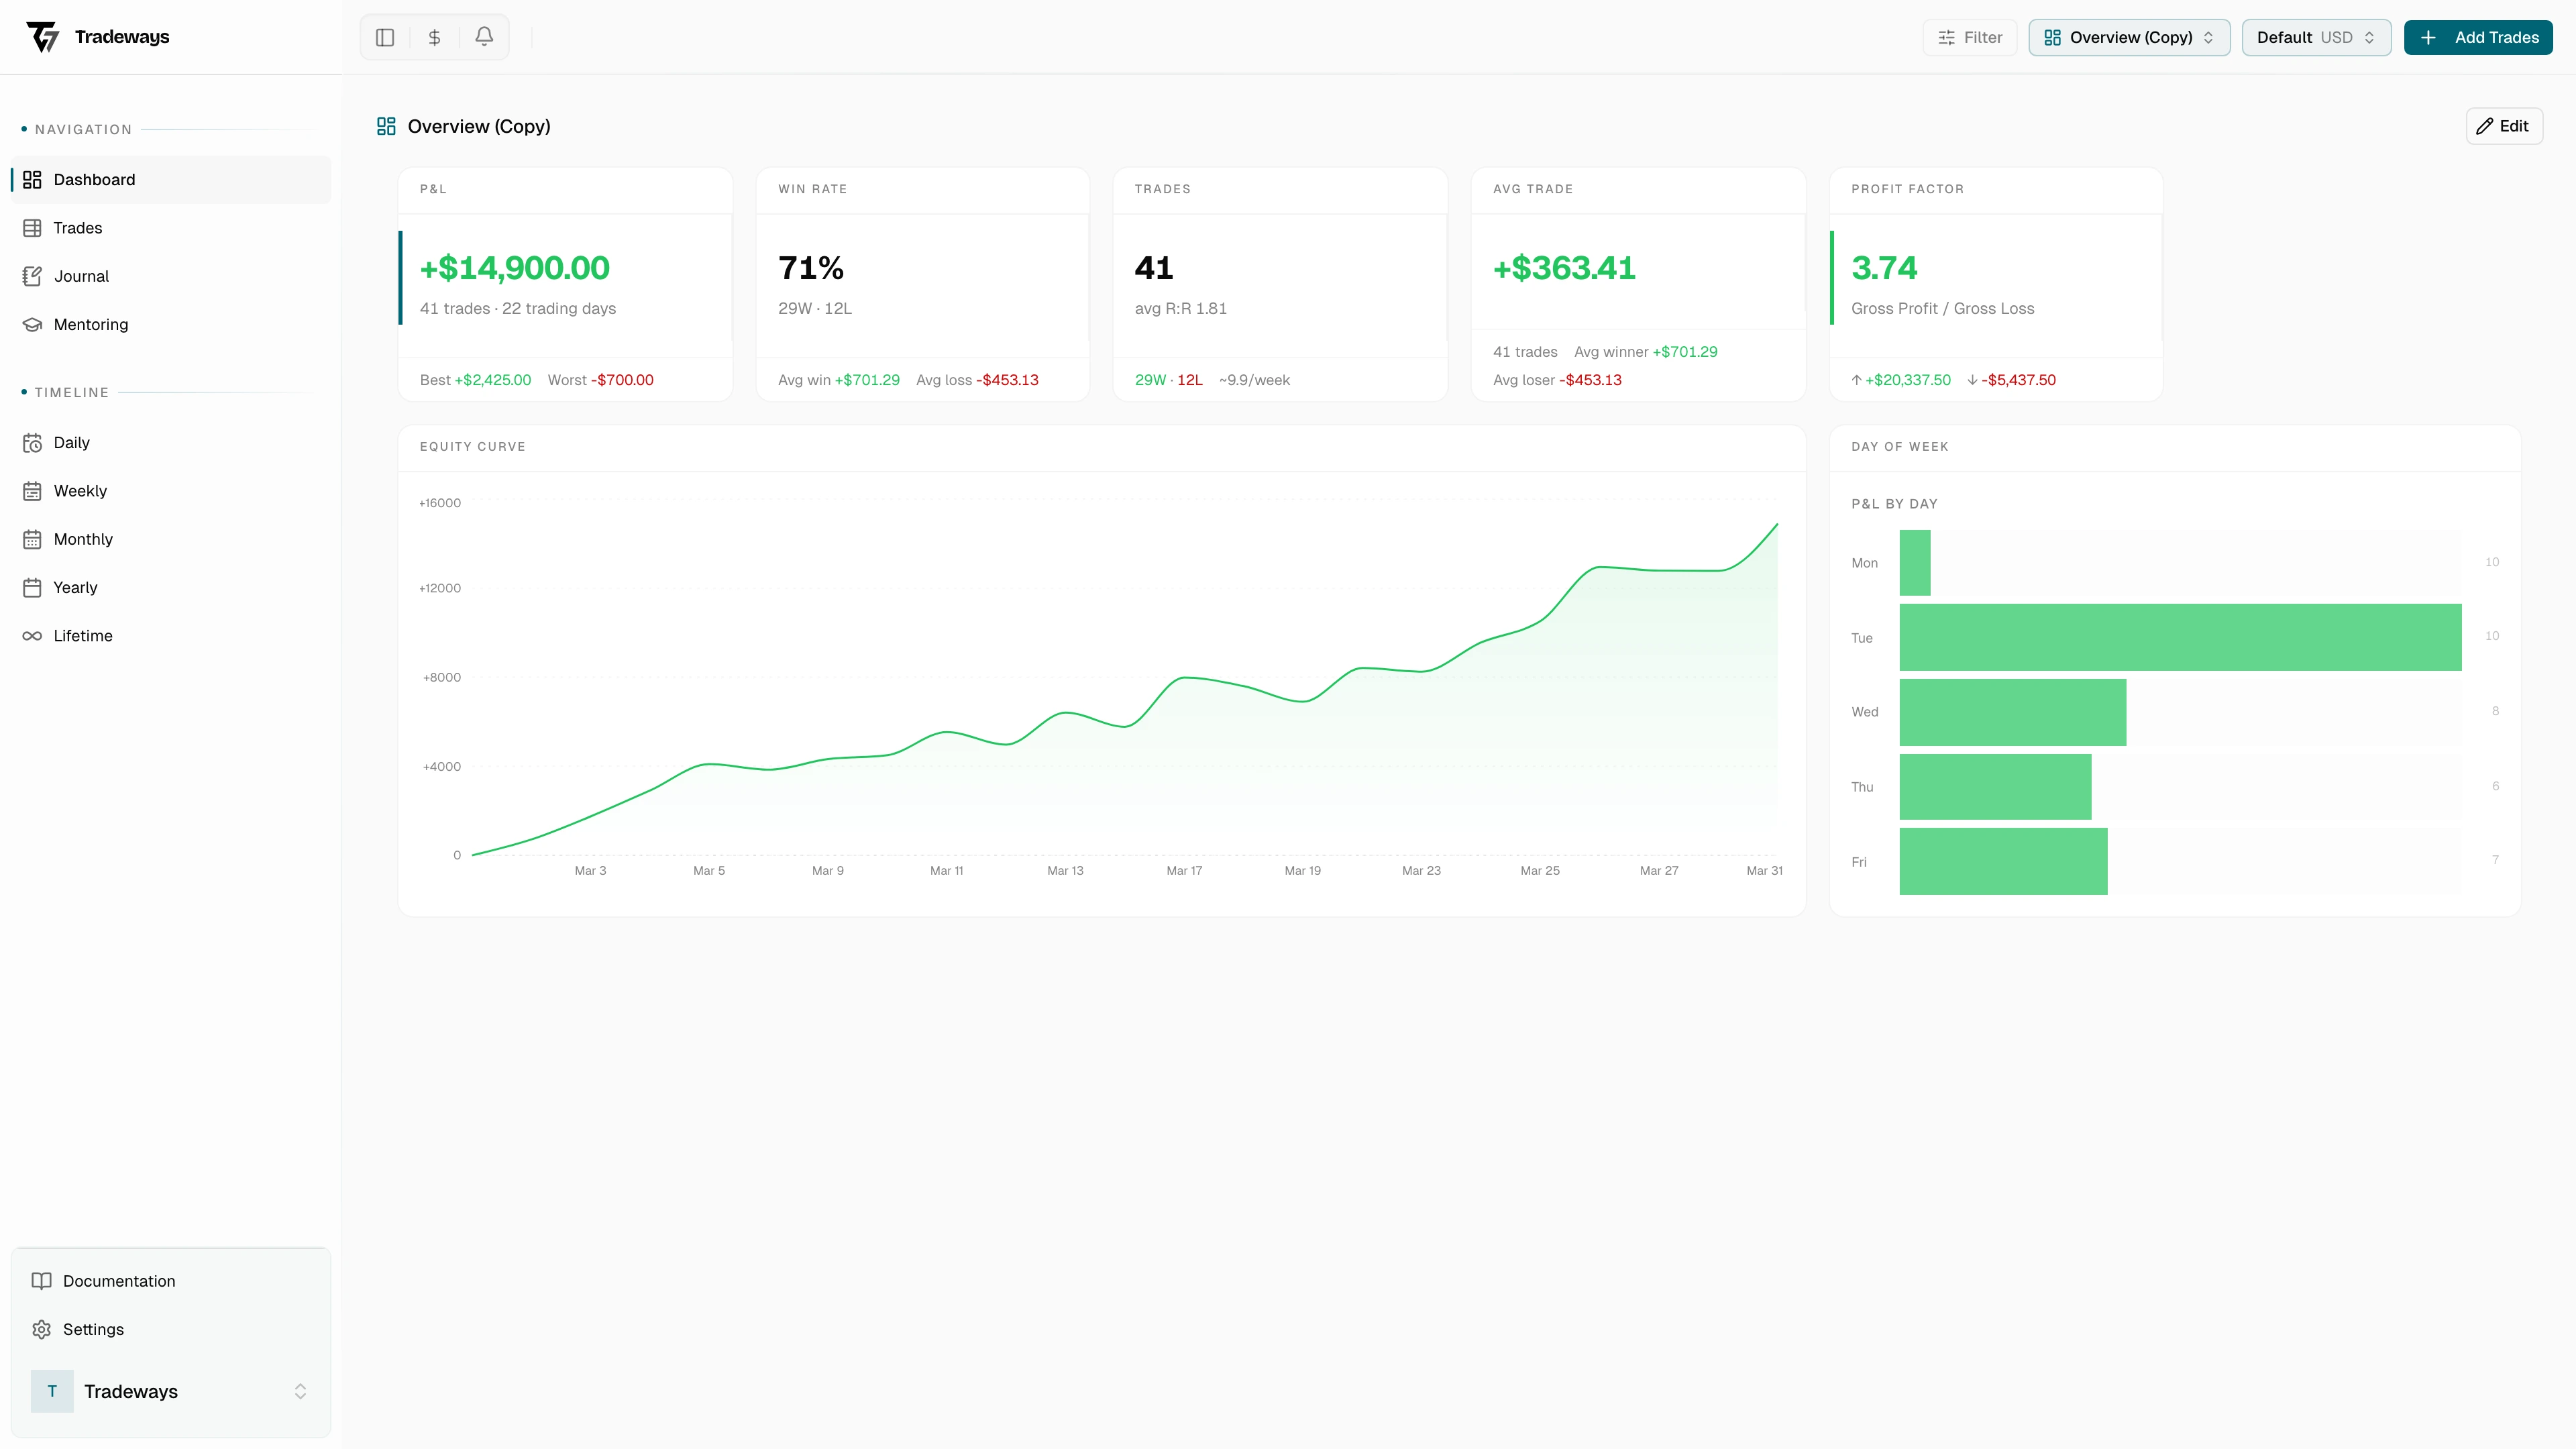
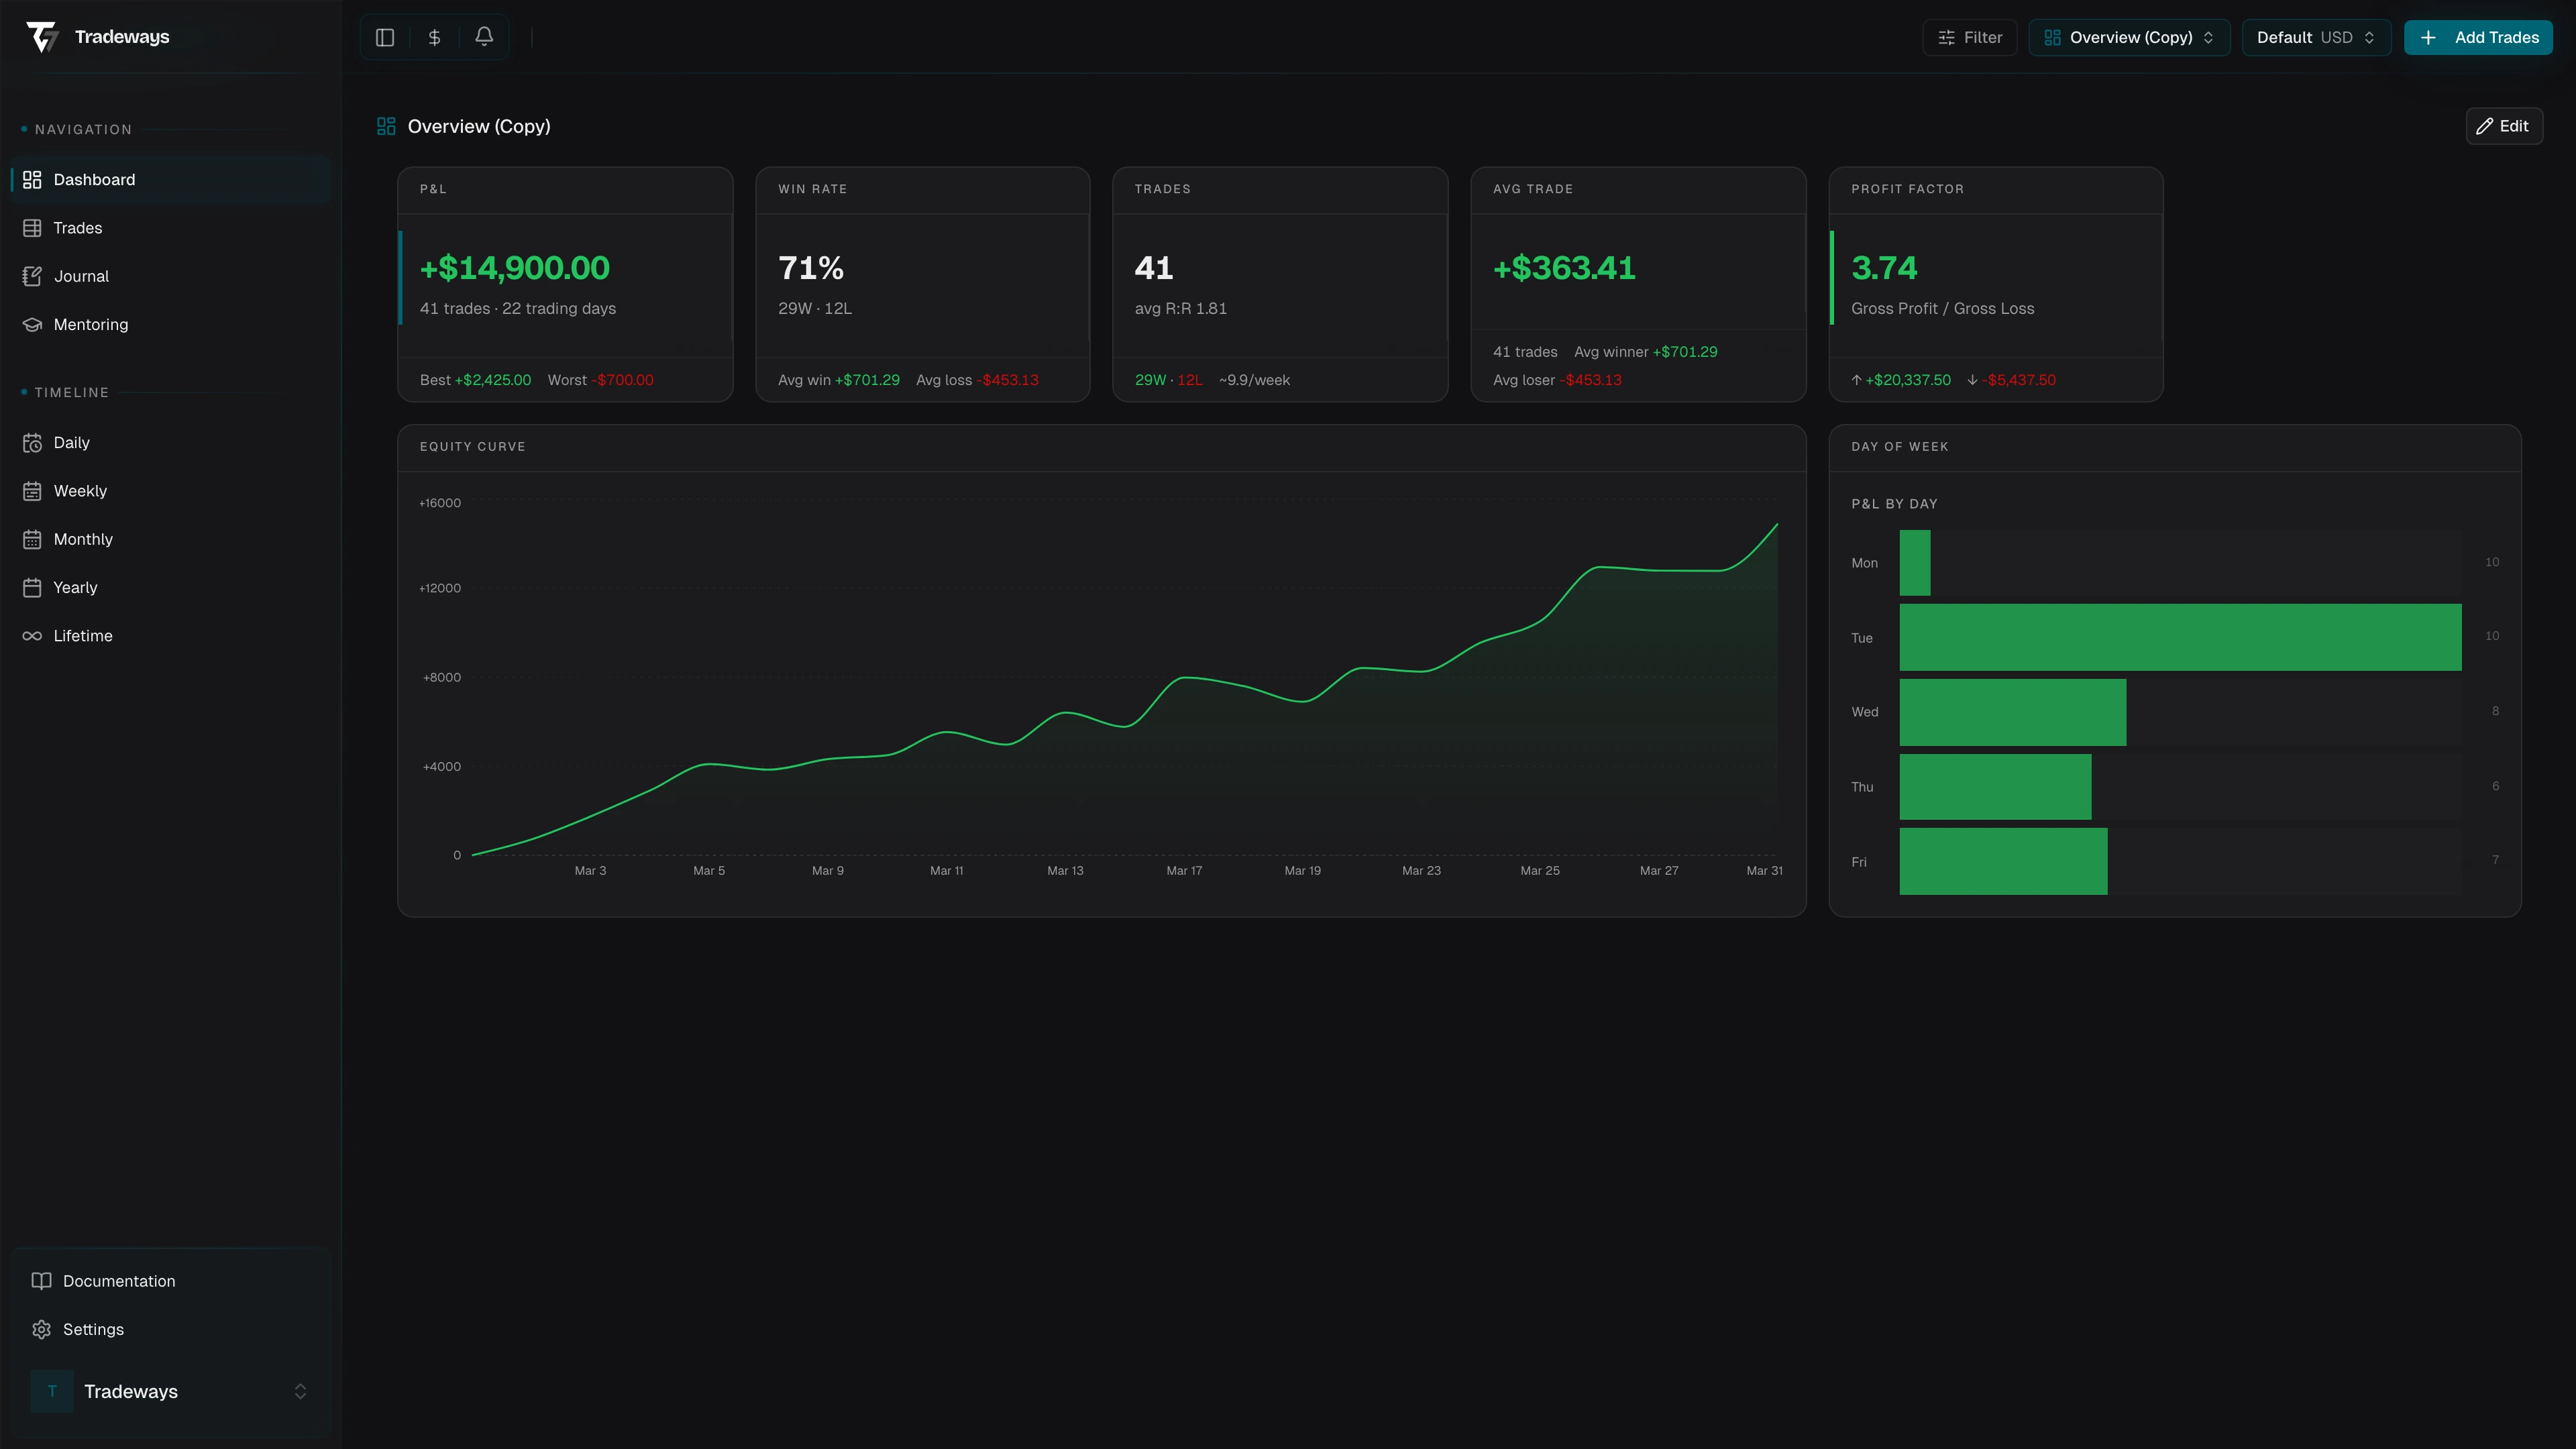
A dashboard is the view you assemble out of the metrics you actually care about. The page at /dashboard renders a grid of widgets against the currently active trading account: KPI cards, charts, heatmaps, journal previews, whatever combination earns its place on your screen. You can keep several dashboards side by side, swap between them, and each account remembers which one was last open.
System, personal, and shared dashboards
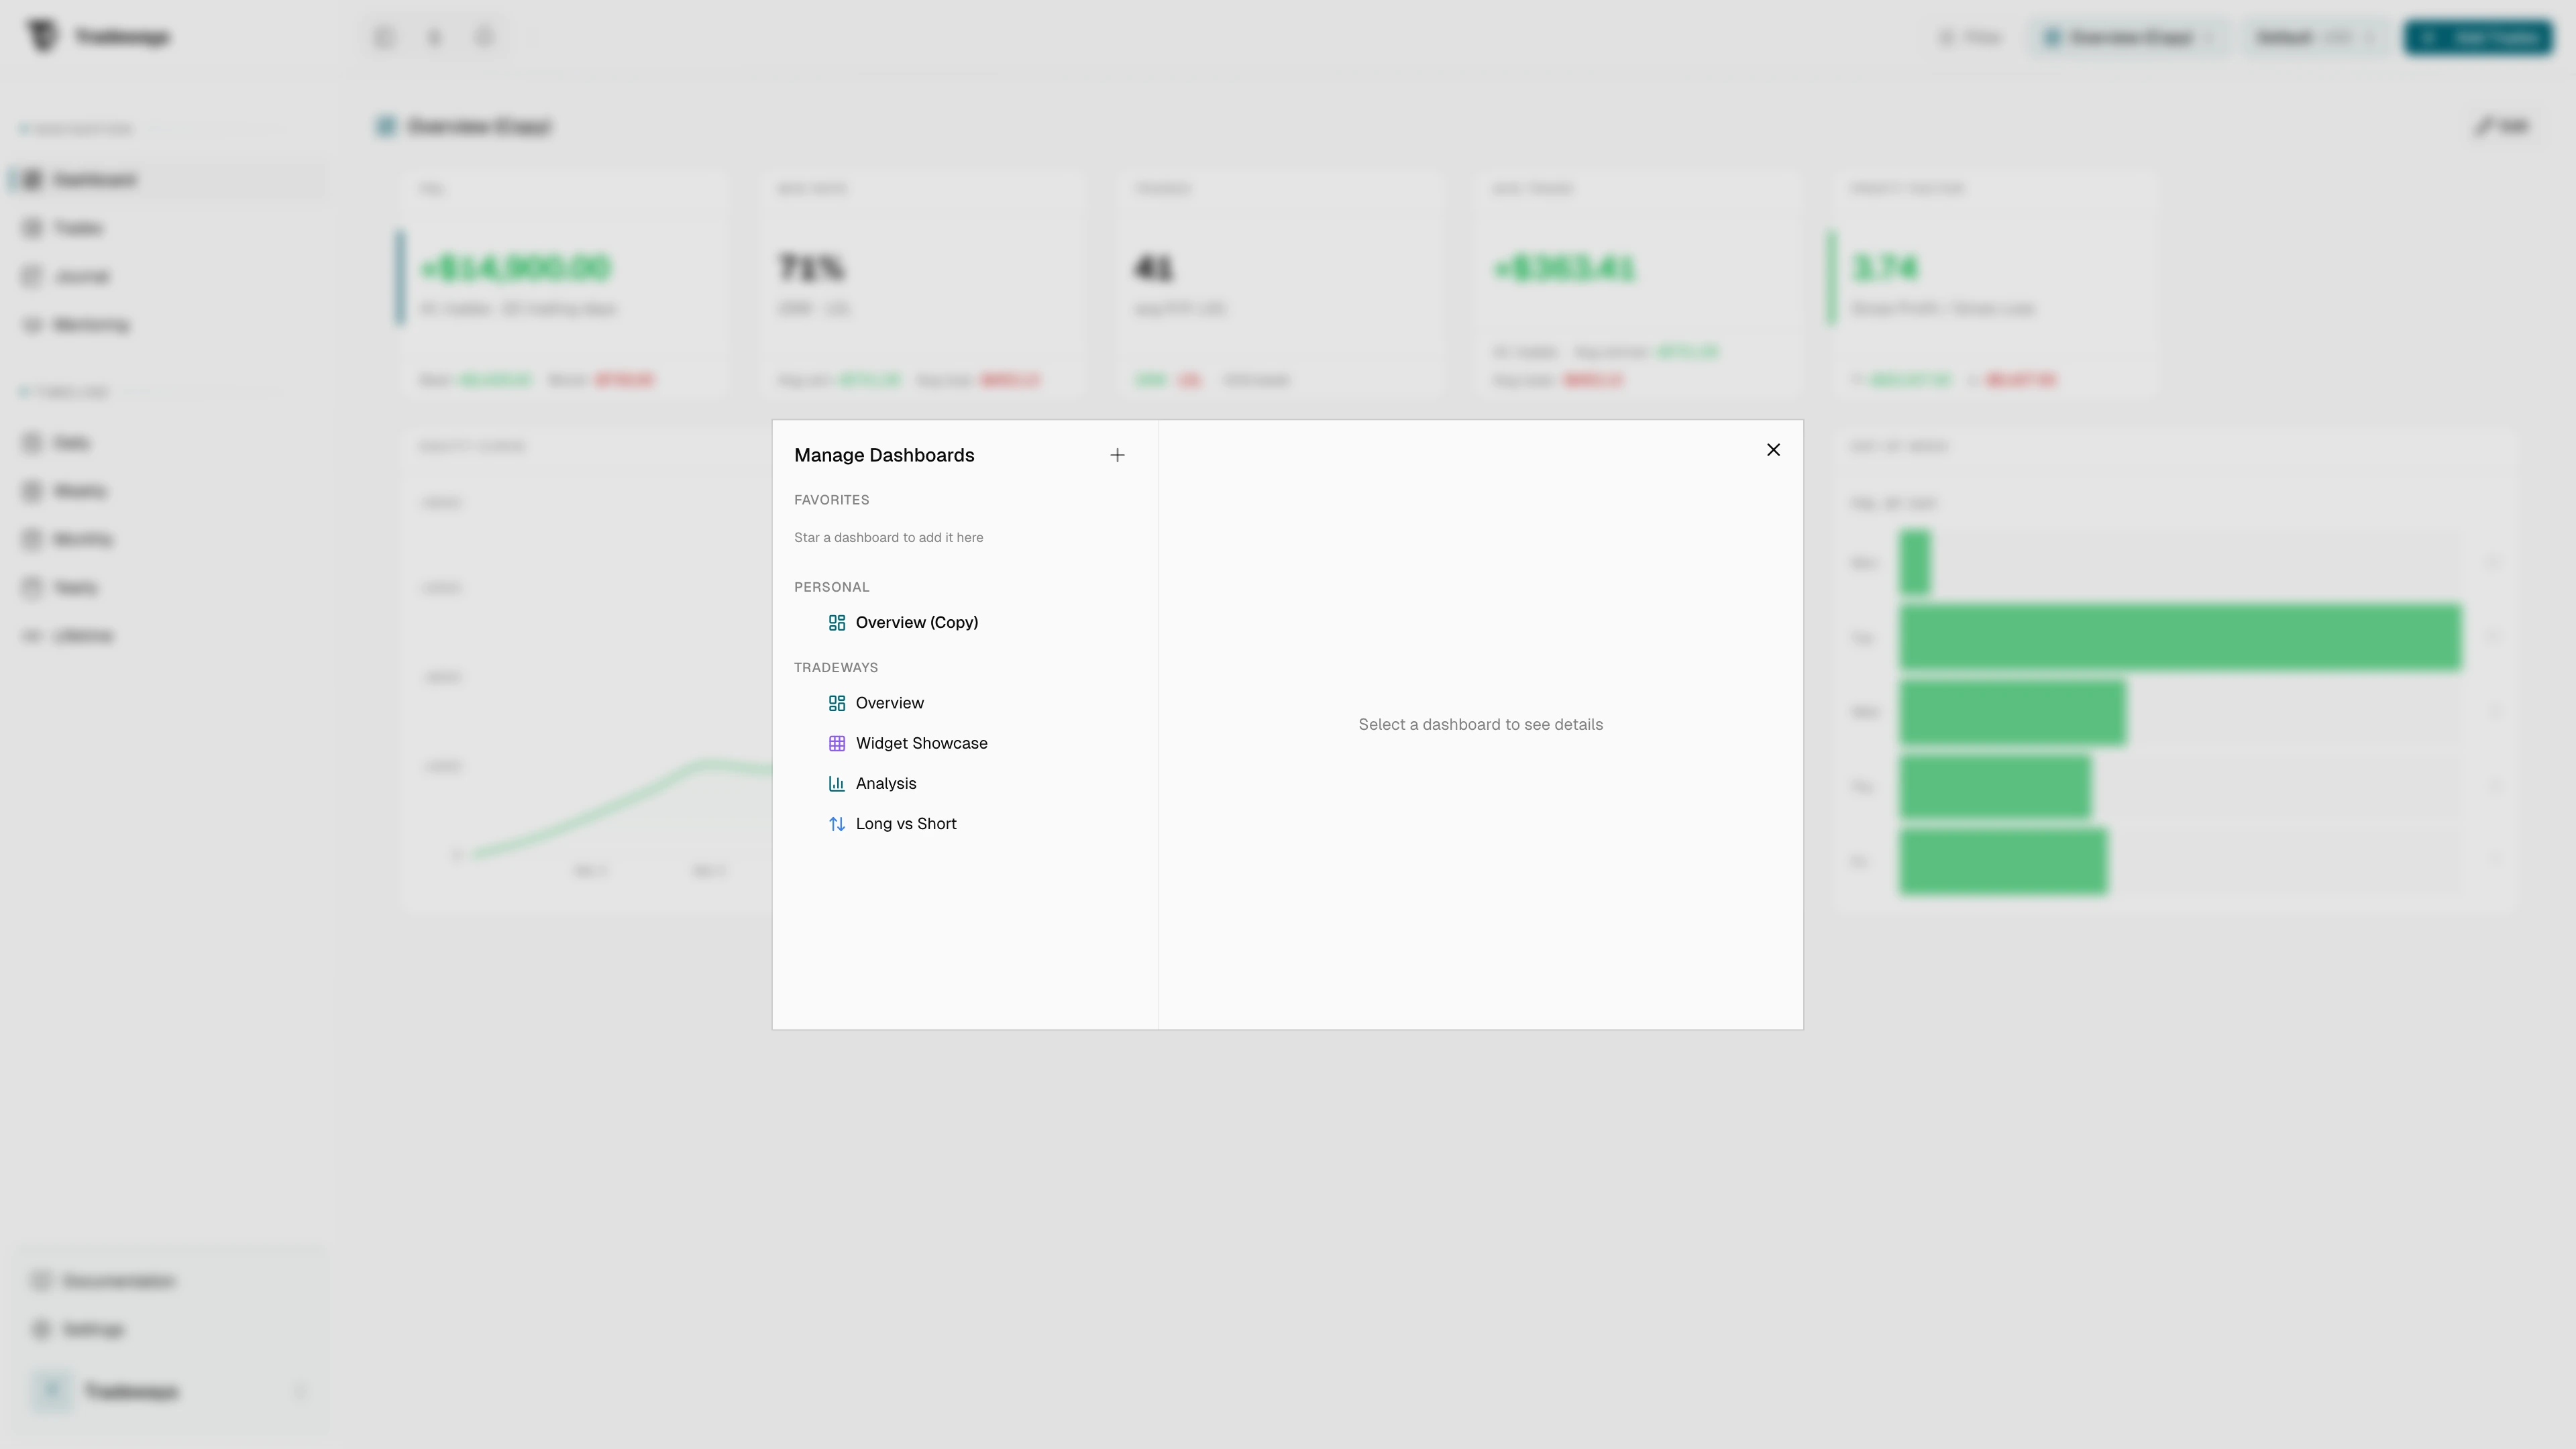
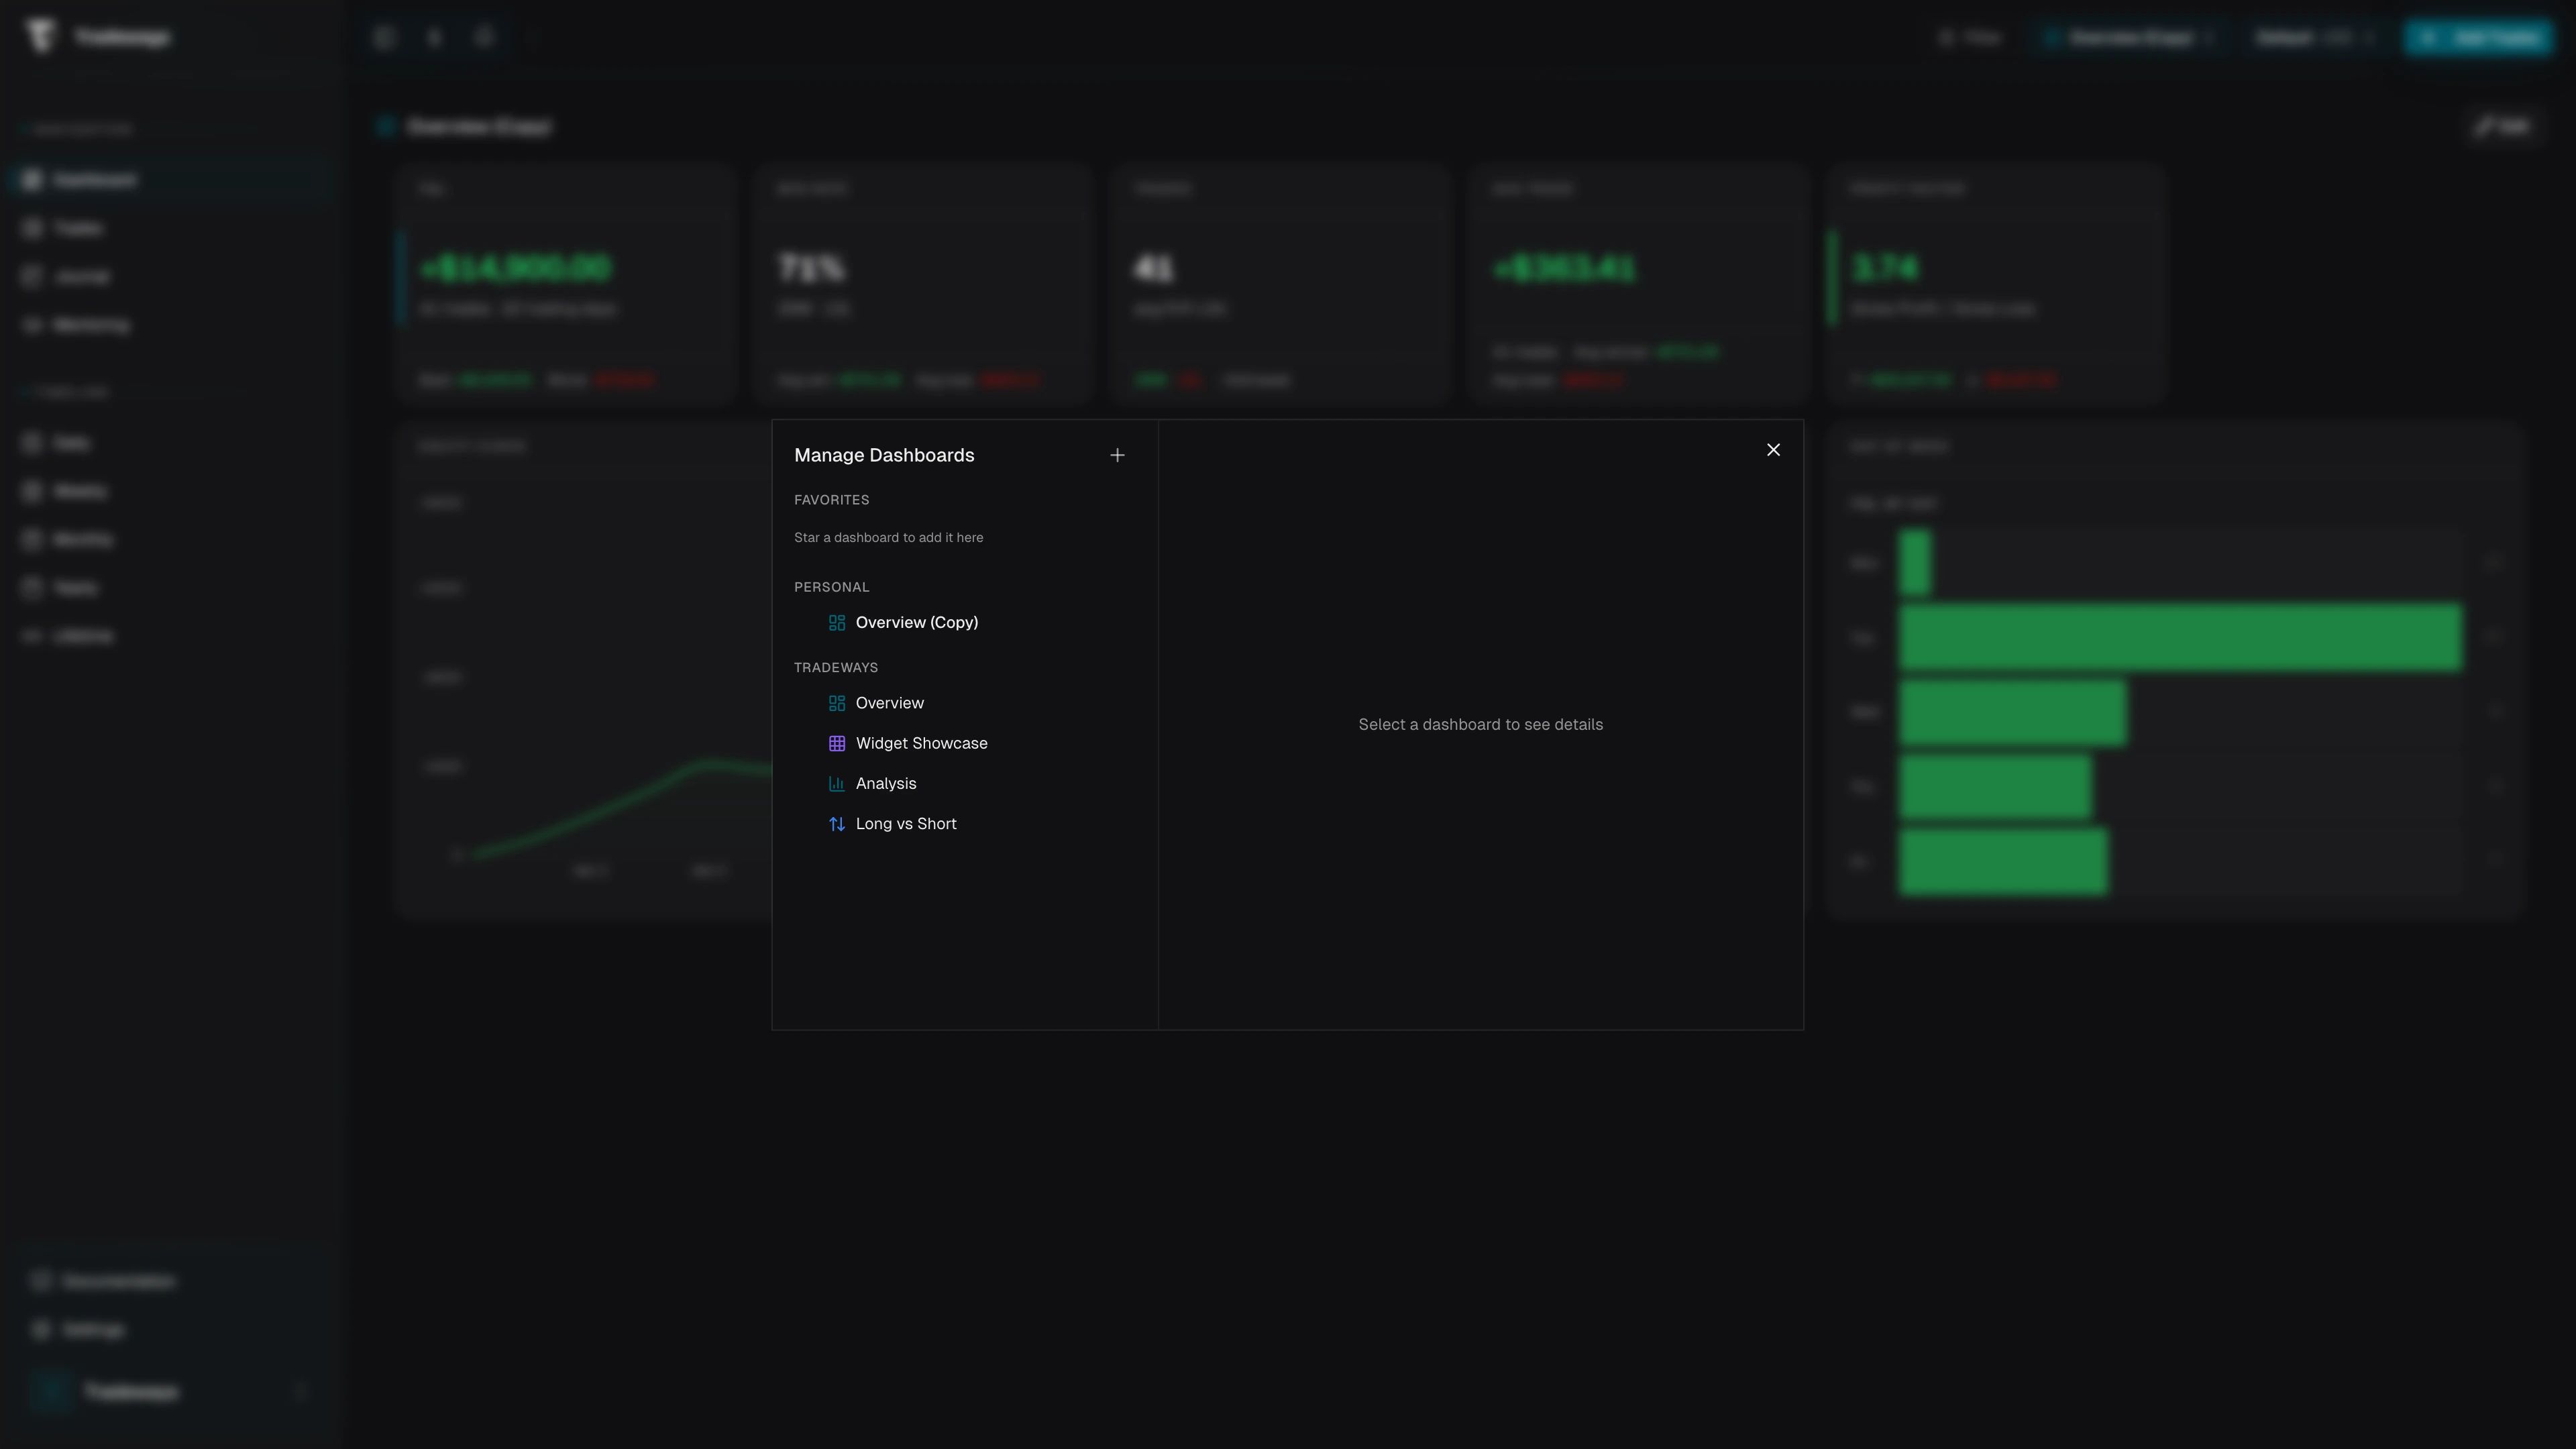
Tradeways ships ready-made dashboards under the Tradeways group. They are useful starting points and they are read-only. Anything you build yourself lives under Personal, and anything a mentor or teammate has shared with you appears under Shared with me, grouped by the person who shared it. The fourth group, Favorites, is what you star for quick access.
Switching between dashboards goes through the dashboard switcher next to the account switcher in the header. The dropdown lists your favorites; pick any one and the active account remembers your choice. Open Manage Dashboards at the bottom of the dropdown for the full list.
In the manage dialog, hovering or clicking a dashboard surfaces its icon, description, and widget count on the right. Personal dashboards can be renamed or deleted there. System dashboards offer Use as Template, which forks them into a personal copy. Shared dashboards open in a read-only state with their owner's data behind them; you can star them but not edit or fork them.
Creating a personal dashboard
Use Create Dashboard in the manage dialog. You give the dashboard a name (required), an optional description, an icon and a color, and you pick a starting point: either Blank or one of the system templates. Starting from a template clones its widget layout into your new dashboard; the two are then fully independent.
Customizing a system dashboard
System dashboards are not editable in place. When you click Customize on one, Tradeways shows a short confirmation explaining that a personal copy will be created. Confirm with Create Copy & Edit and you land in edit mode on the fork. The original Tradeways dashboard stays unchanged and remains available to everyone.
Edit mode
Edit mode is the same regardless of whether you opened a personal dashboard directly or just forked a system one. The toolbar swaps to show a breakpoint preview (Desktop / Tablet / Mobile), Add Widget, Cancel, and Save.
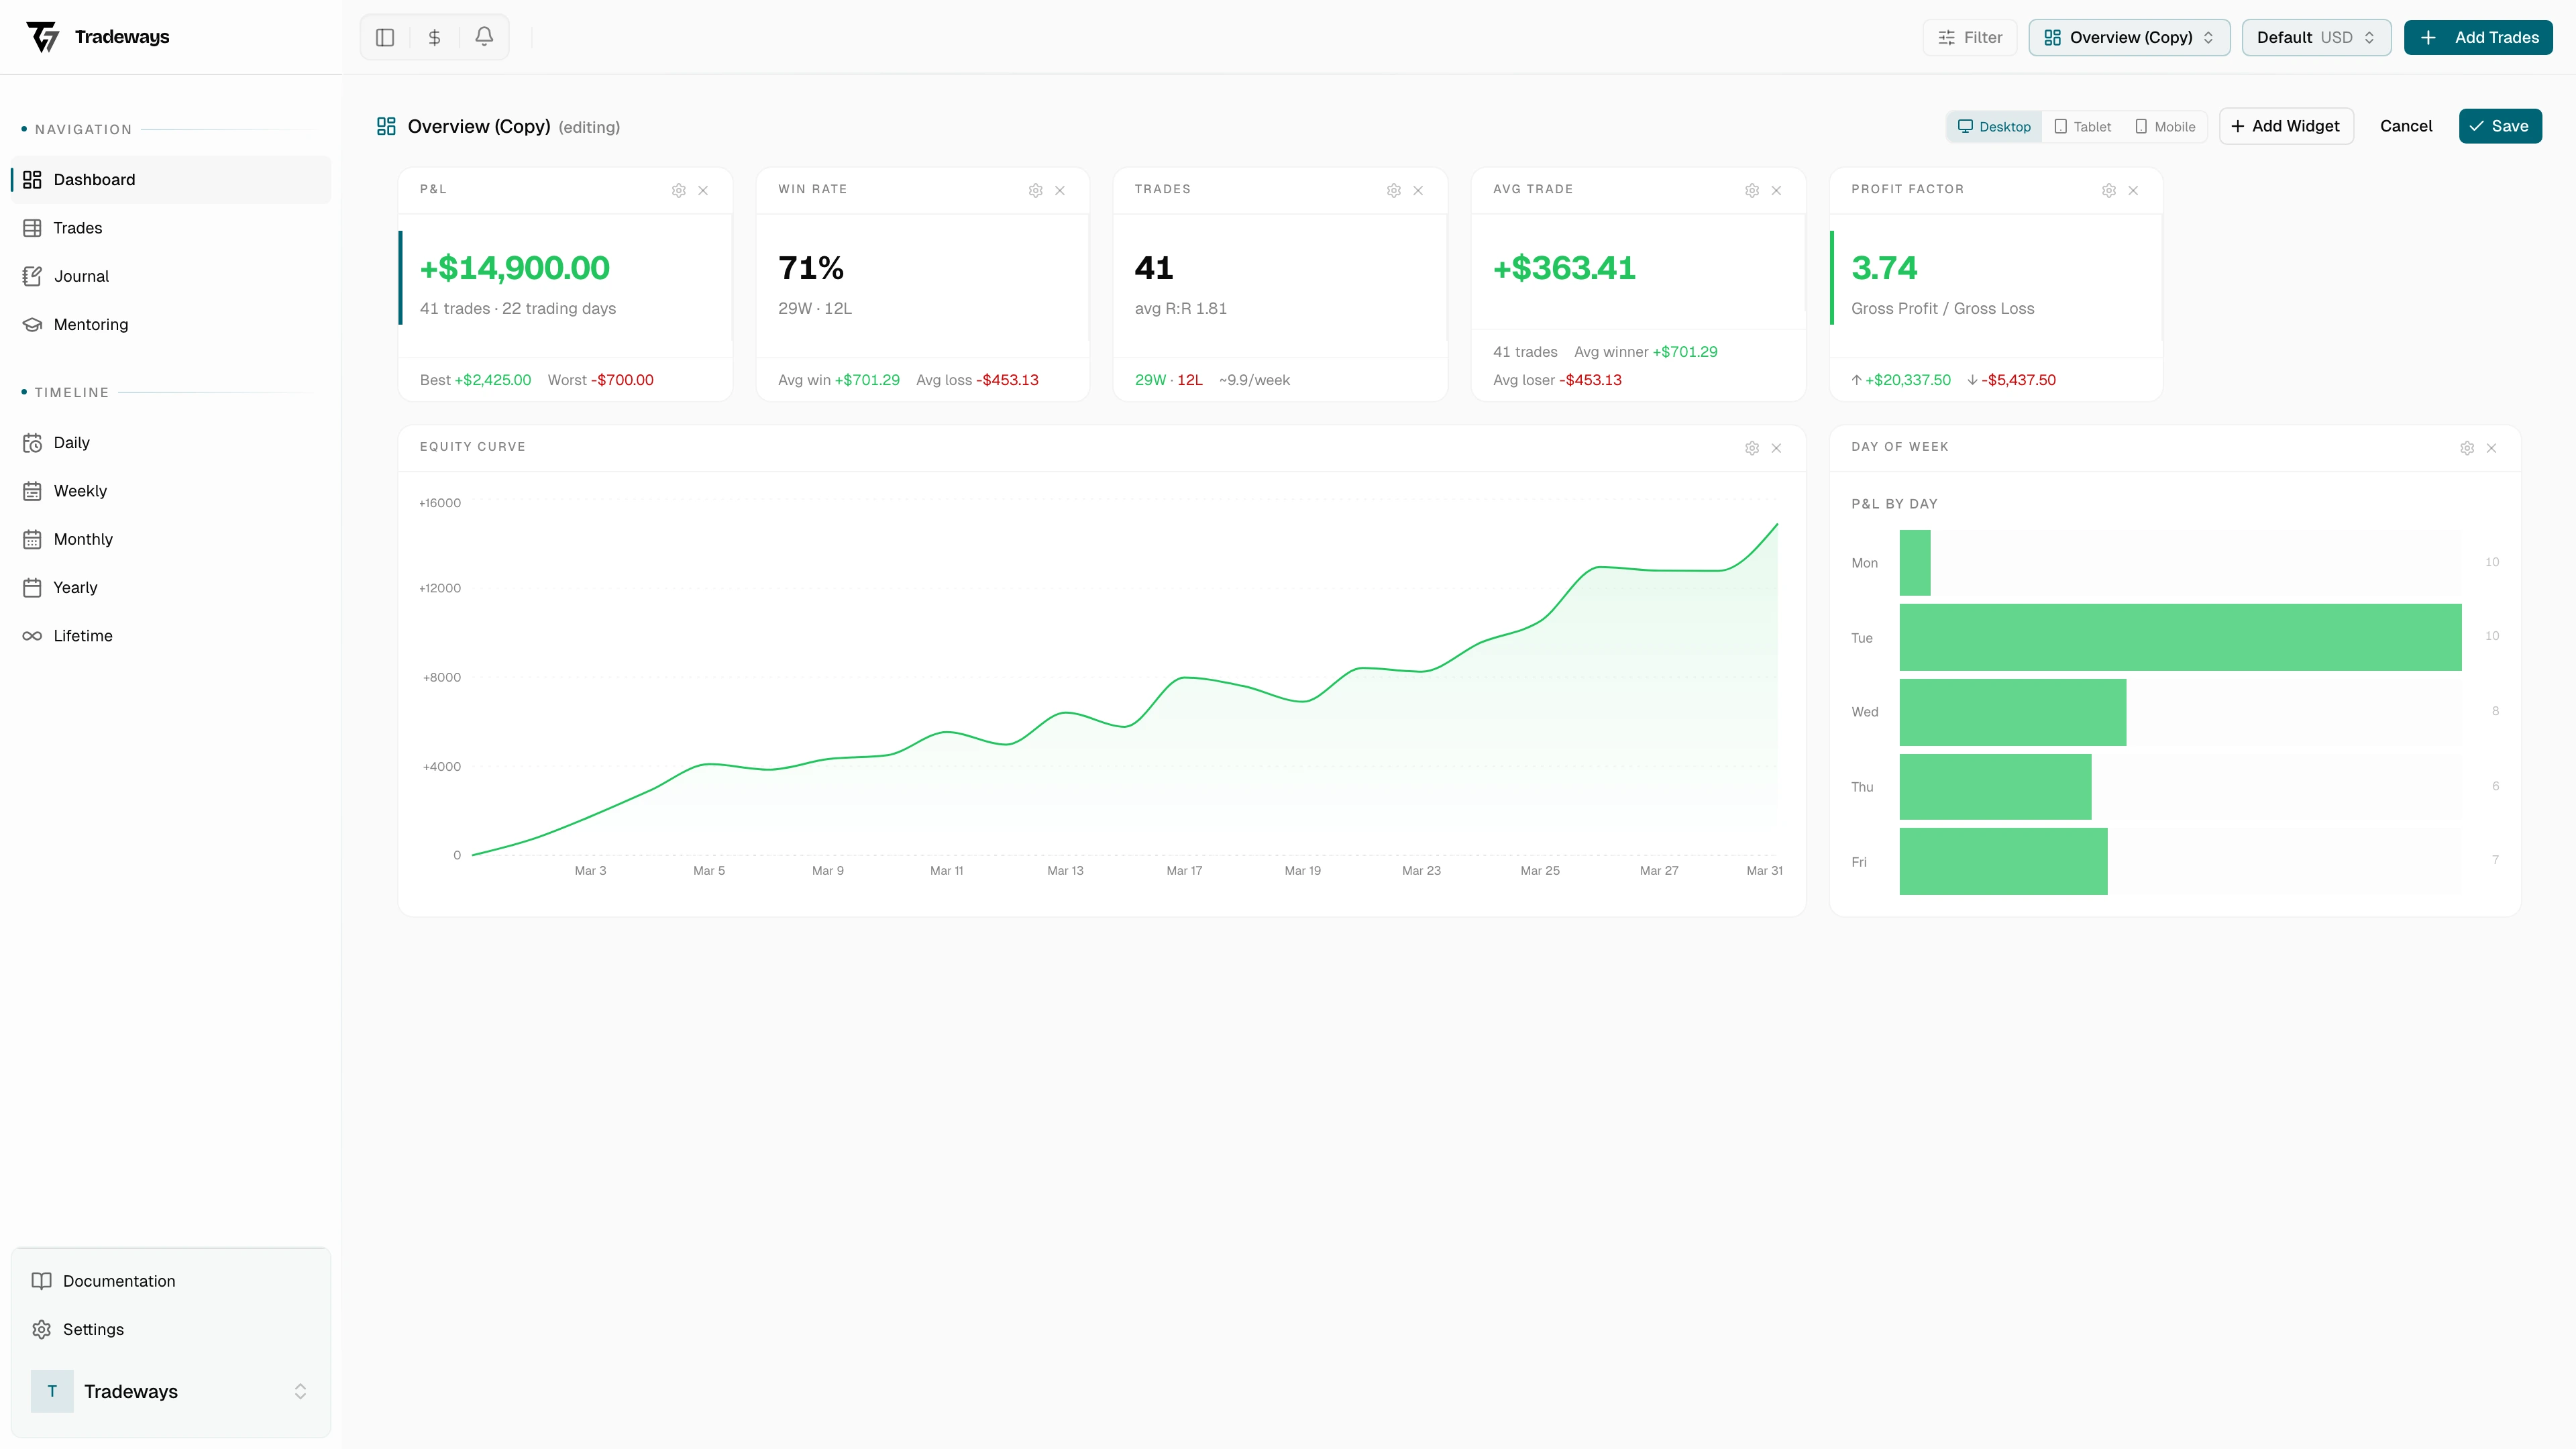
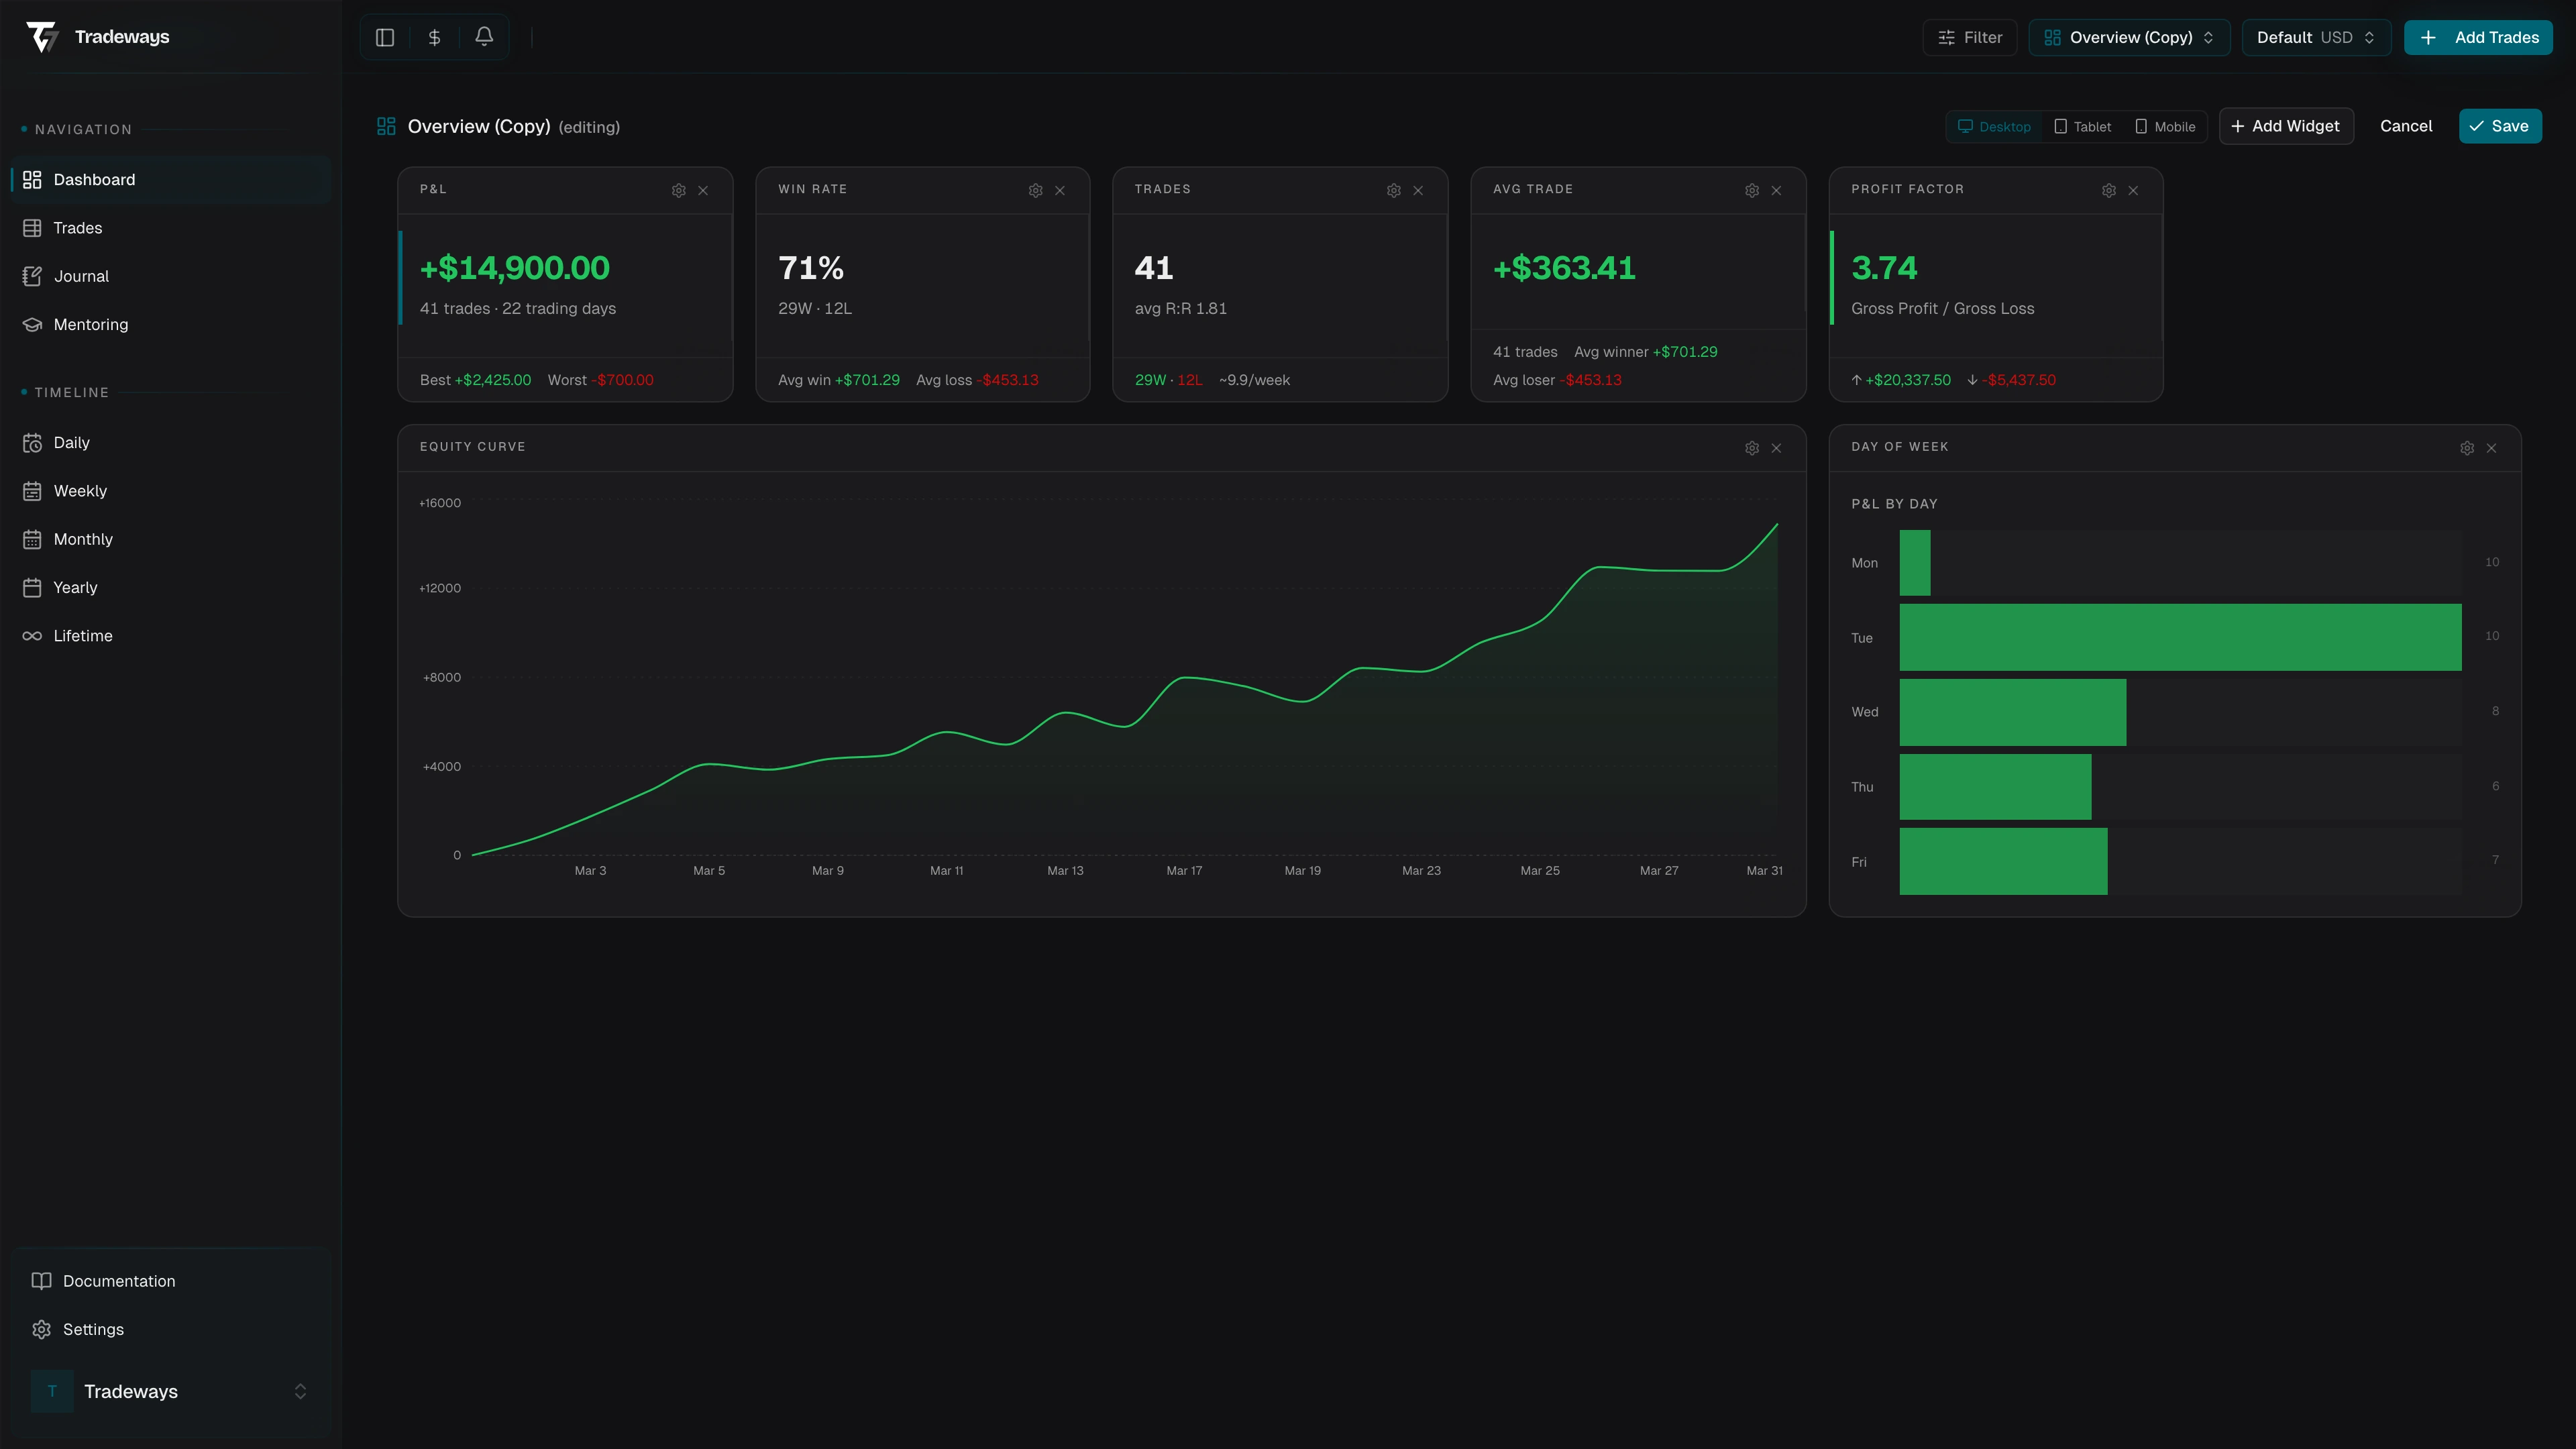
Drag a widget by its header to move it. Drag the bottom-right corner to resize. The grid snaps to a responsive column count, so the same dashboard reflows automatically when the viewport gets narrower; the breakpoint toggle lets you preview each size before saving. Each widget gets a remove control (the X) in its header while you are editing.
Add Widget opens the picker. The picker is divided into Widgets (the base building blocks), Quick Add (pre-configured presets), Based on Your Data (suggestions Tradeways generates from patterns in your trades), Your Symbols, Your Asset Classes, Your Tags, and Strategy & Review. Inside Widgets and Quick Add, items are further grouped by category: Directional, Analysis, Time Period, Result-Based, and Asset Class. Hover any item to see a live preview. See Widgets for the full catalog of available widget types.
Nothing is written to the server until you confirm with Save. Cancel drops every change and returns to the last saved layout. If you have unsaved changes and try to switch dashboards, switch accounts, or navigate away, a confirmation dialog gives you the chance to keep them.
Per-widget settings
Each widget can carry its own settings. In edit mode, click the gear in the widget header to open a dialog with two tabs.
Settings holds the widget title override, an optional account pin, and any widget-type-specific options (for example the risk-free rate for the Sharpe and Sortino widgets). A pinned widget always reads from a specific account regardless of which one is active in the header, which is what makes shared accounts viewable inline. A small badge in the widget header shows the pinned account; if that account is later removed or the share is revoked, the widget displays an "account unavailable" message instead of data.
Filter lets you give the widget its own trade filter covering date range, status, side, result, symbols, tags, weekdays, and time of day. You then choose how that filter combines with the global dashboard filter: Replace ignores the global filter and uses only the widget filter, Layer intersects the two so both constraints apply. The Long vs Short system preset is built entirely on this; each card scopes itself to one direction.
Managing dashboards
Inside the manage dialog you can rename and edit the description of any personal dashboard inline, change its icon and color, star it into Favorites, and delete it. Deleting warns you if the dashboard is currently active on one or more accounts; those accounts then fall back to the default. Sharing is configured from the mentoring settings, not here; shared dashboards still surface under Shared with me.
Per-account memory
Each trading account independently remembers which dashboard was last active. Switch accounts and the dashboard switches with you. New accounts start on the default Tradeways dashboard.