Yearly View
A full year of trading as a heatmap, plus a month-by-month breakdown and goal progress.
Yearly View
The yearly view is the zoom for spotting seasons. A full calendar year fits on one screen, so streaks, dry spells, vacations, and the months where you actually performed are obvious without scrolling. It answers "what did my year actually look like?". The week view answers "how did this week go".
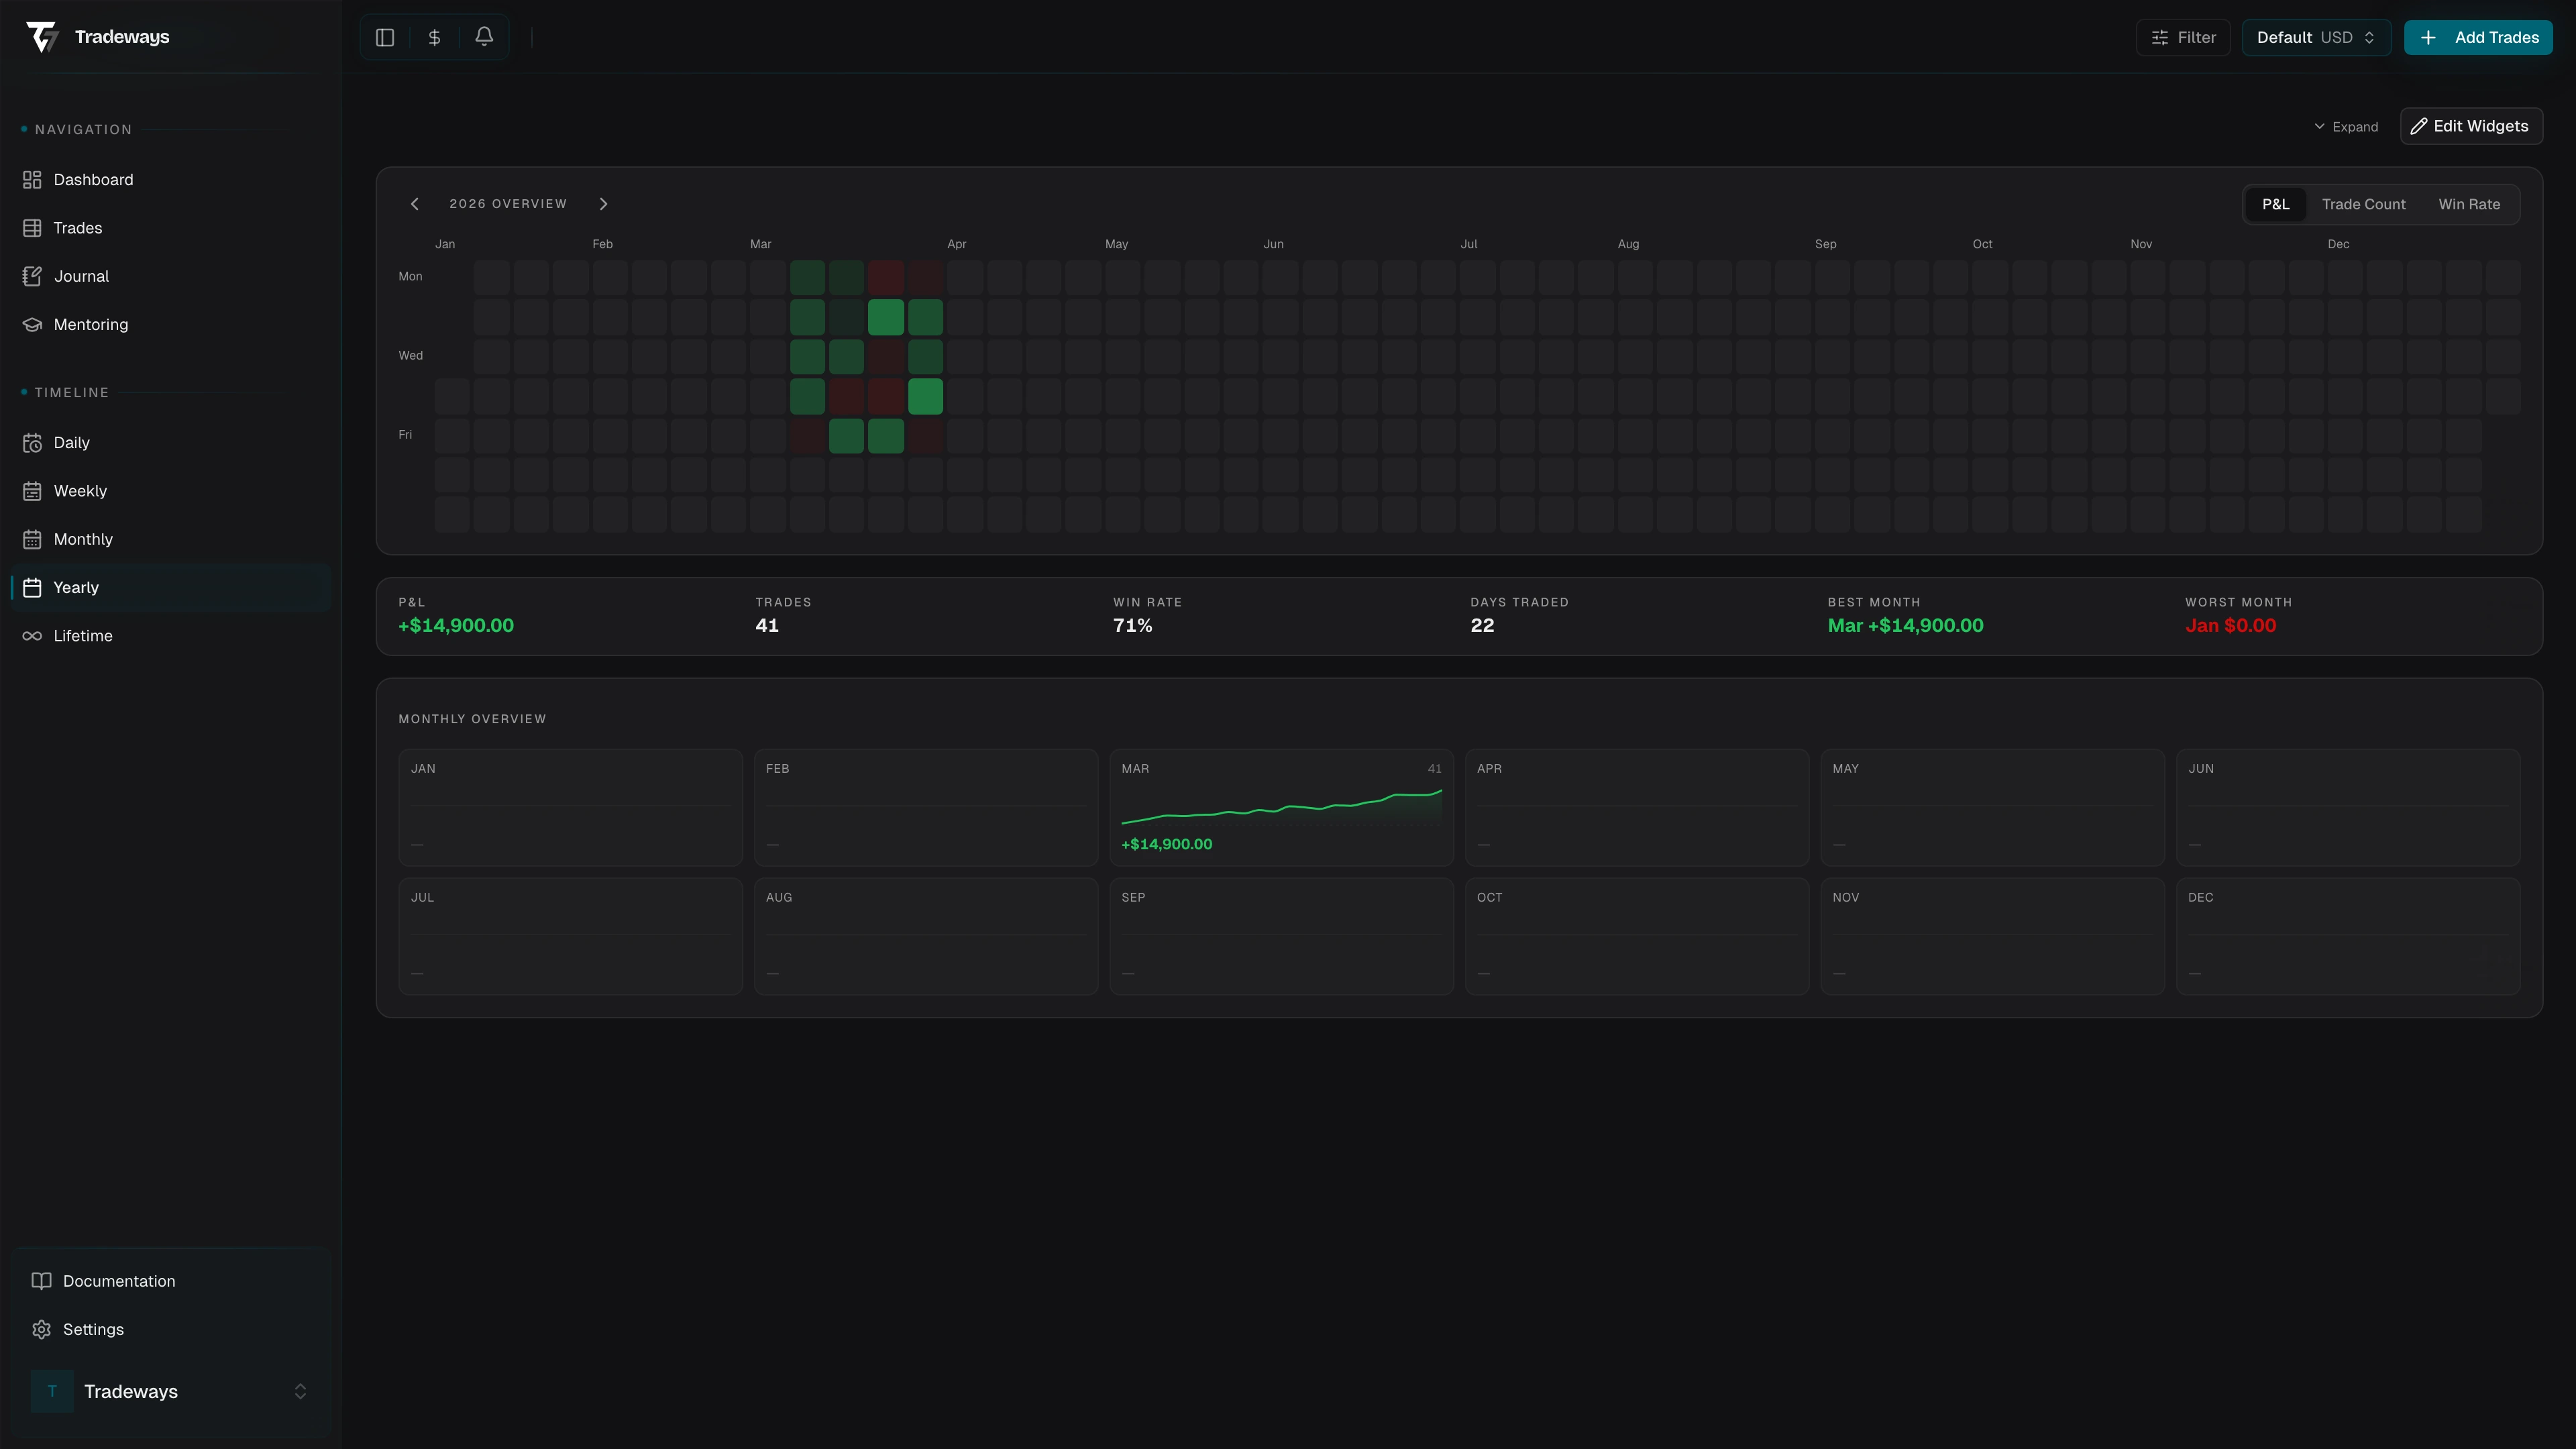
Navigate with the prev/next arrows or the year popover in the header. The heatmap can be coloured by P&L, by trade count, or by win rate.
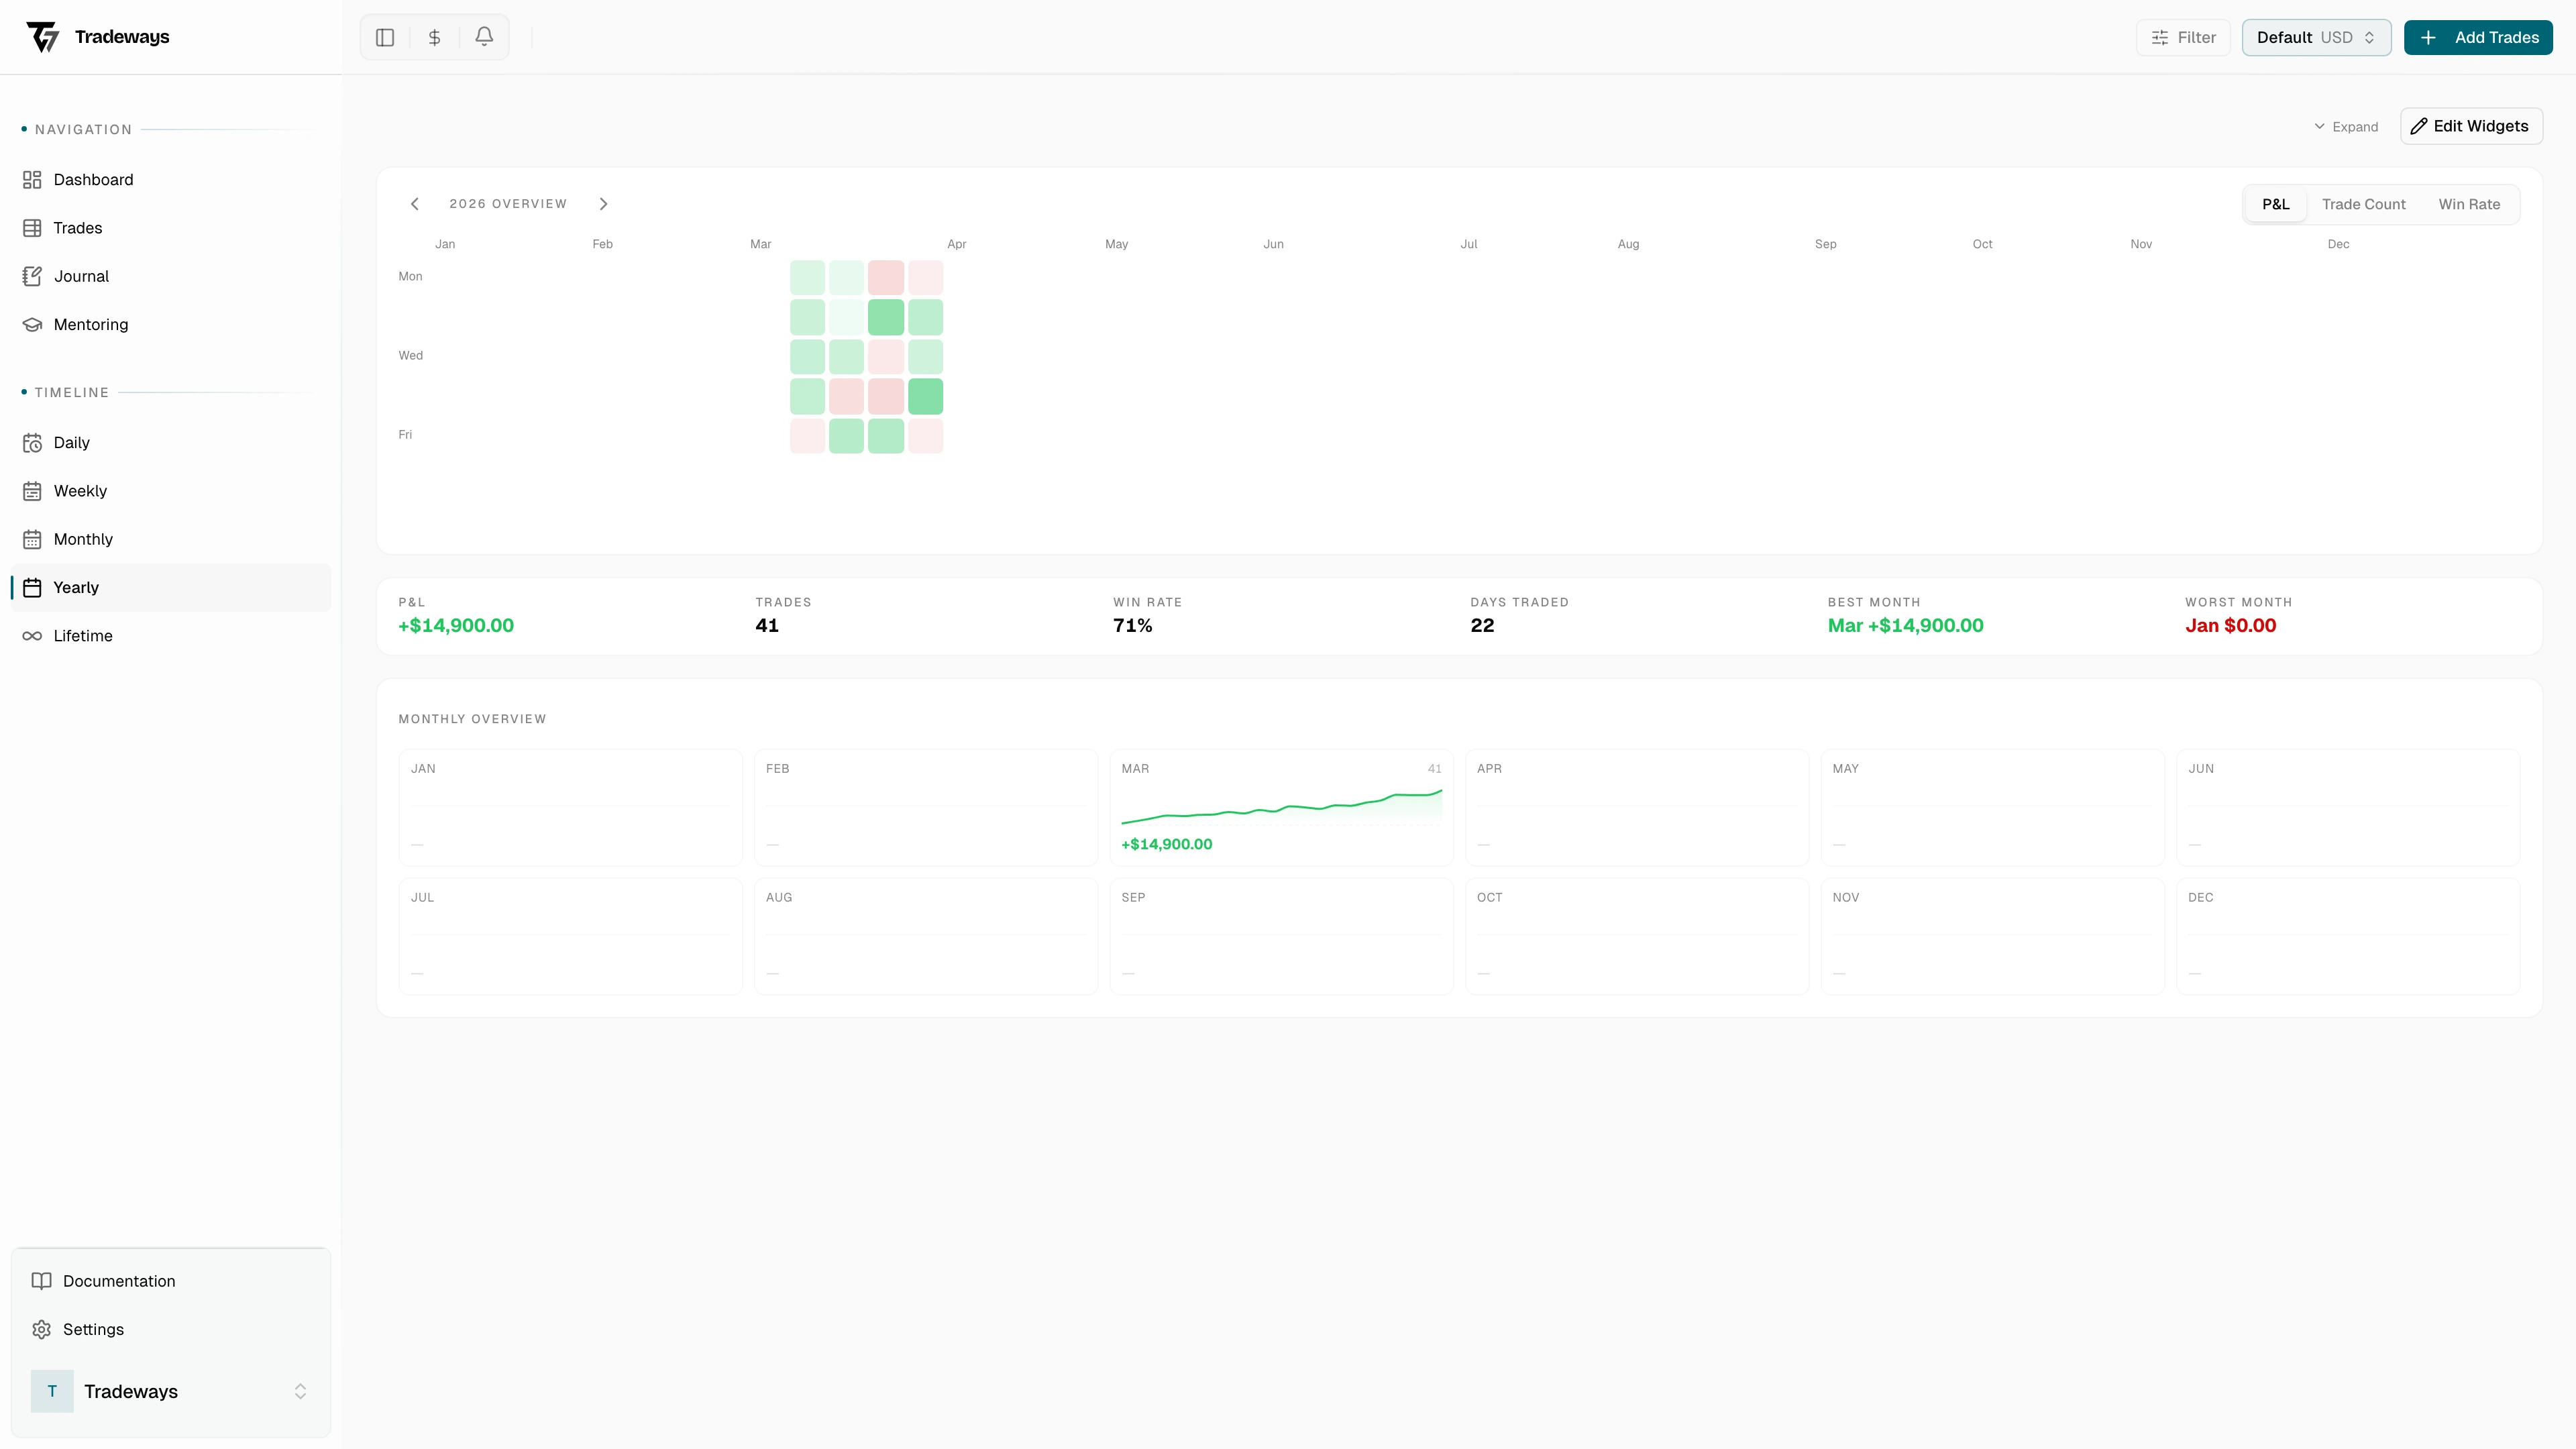

The heatmap
Each cell is one trading day. The toggle above the heatmap switches what the colour represents:
- P&L: green for profitable days, red for losing days, saturation by magnitude
- Trade Count: how busy each day was
- Win Rate: how often you closed in the green that day
Switching metrics is the whole point of the view. The three answer different questions. P&L shows where the money came from. Trade count shows whether you overtraded during chop. Win Rate flags days when you were technically right but, against the P&L view, may have hit small winners and large losers.
Hover a cell for the date, P&L, win/loss/breakeven breakdown, and win rate. Click to jump to the daily view.
Summary tiles
Below the year overview sit a handful of stats: P&L, Trades, Win Rate, Days Traded, Best Month, Worst Month. The two month tiles are the ones to internalise. If your best month is three times your worst, you have a real edge. If they're similar in magnitude, you're effectively flat and need to look at risk control before adding markets or size.
Monthly Overview
Each month gets its own card with the trade count, a running equity sparkline, and the month's P&L. Months you didn't trade show a dash, not a zero. The cards are the bridge between the year heatmap and the month view. If a card jumps out, click into it.

Goal progress
If you've set yearly, monthly, or weekly goals, the page shows where you stand against them: current value, target, and percentage. Goals you haven't configured won't appear; set them on the goals settings page.
When the filter excludes every trade for the year, the page shows "No trades in {year}".
See also
- Month view to drop one zoom level down
- Lifetime view for the all-time picture
- Filter to limit which trades the year considers