

Monte Carlo Analysis
Simulate alternative outcome paths from your matching trade history.
Monte Carlo analysis
Monte Carlo analysis runs many simulated paths from your past trades. It shows how much the final result, maximum drawdown, and longest losing streak can change when the same record produces different paths. The simulation describes your historical sample. It does not forecast future returns.
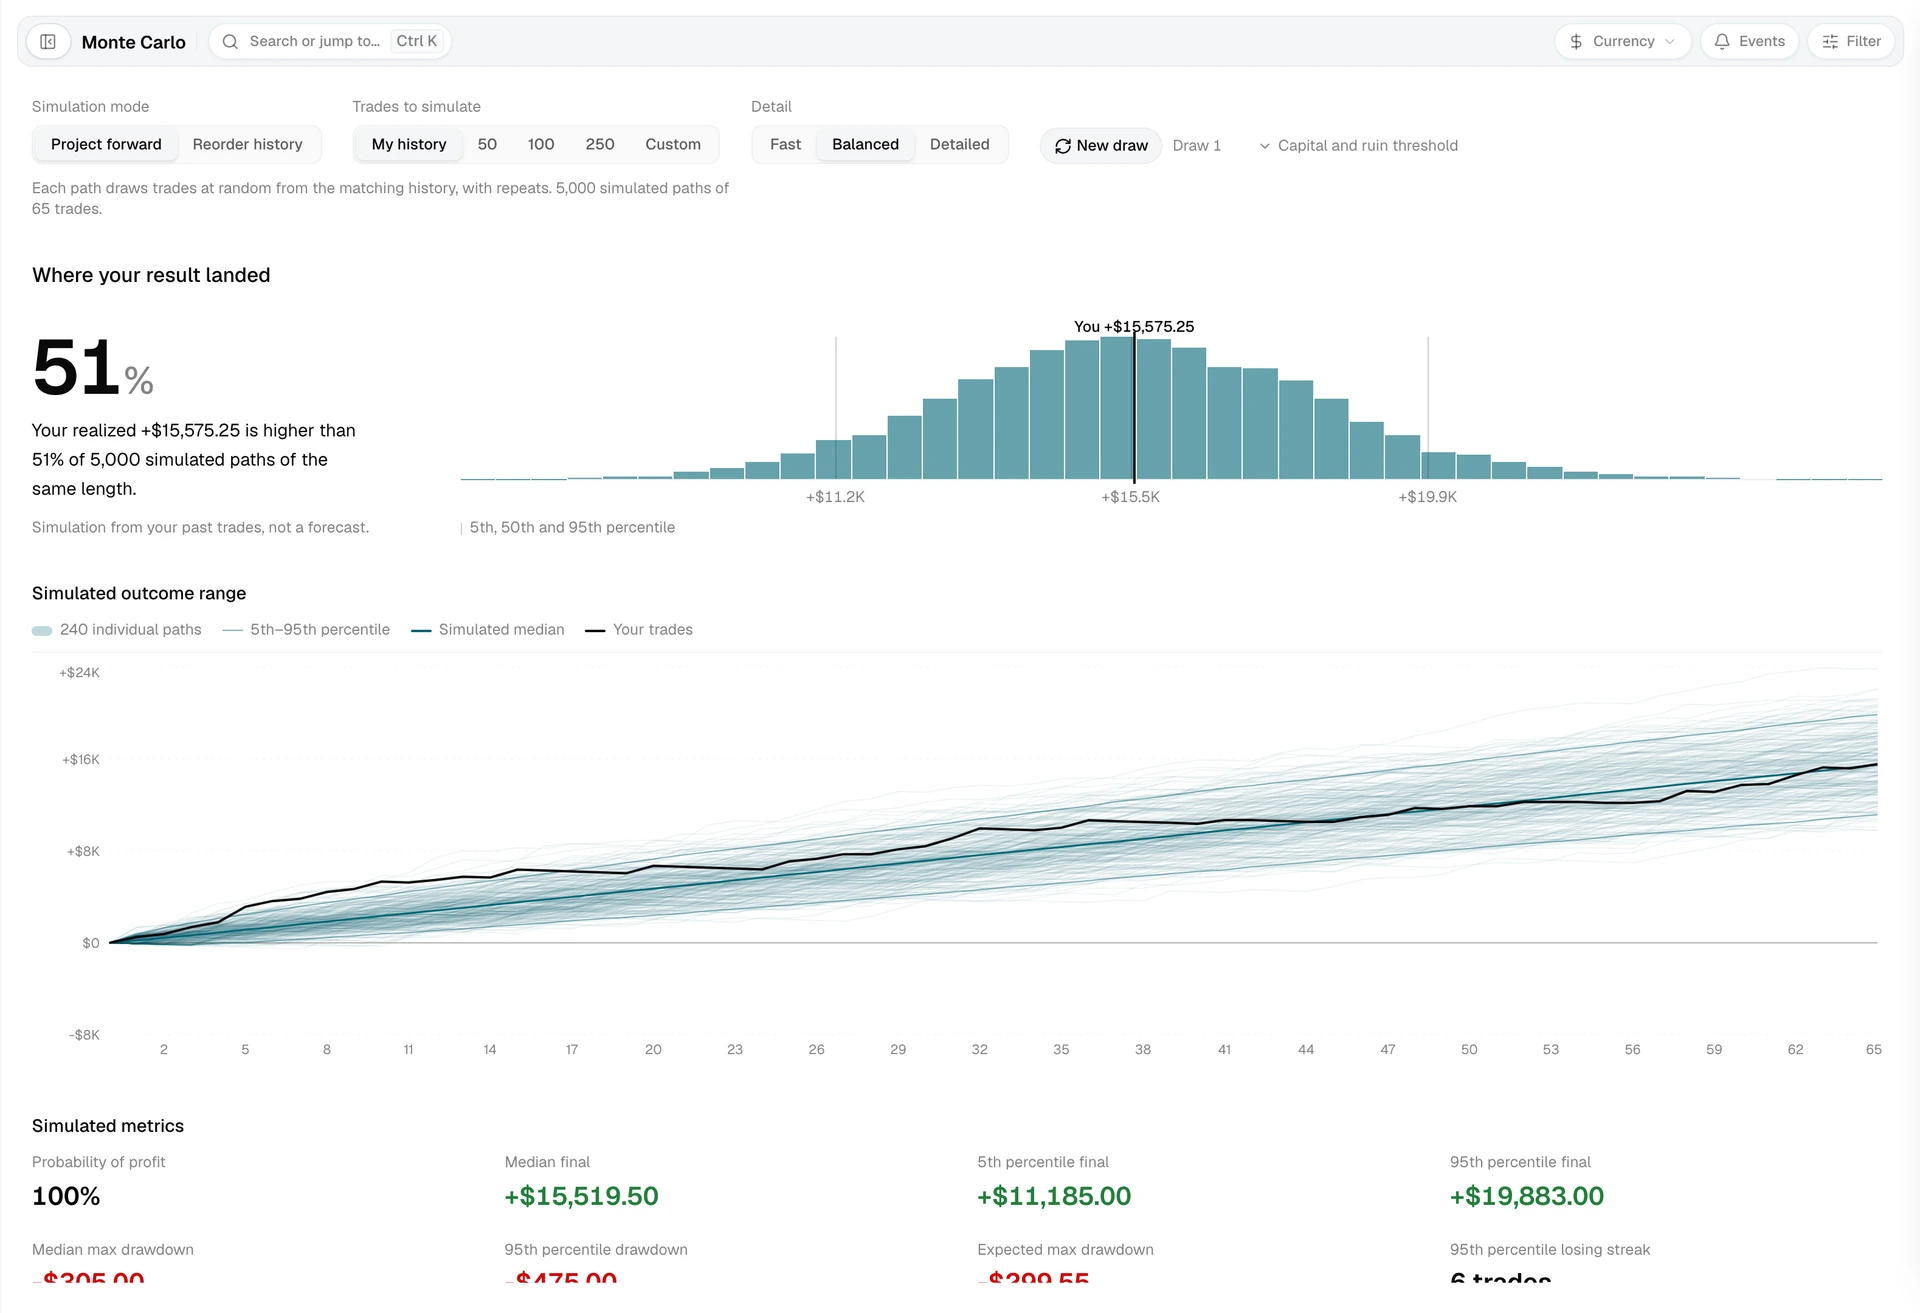
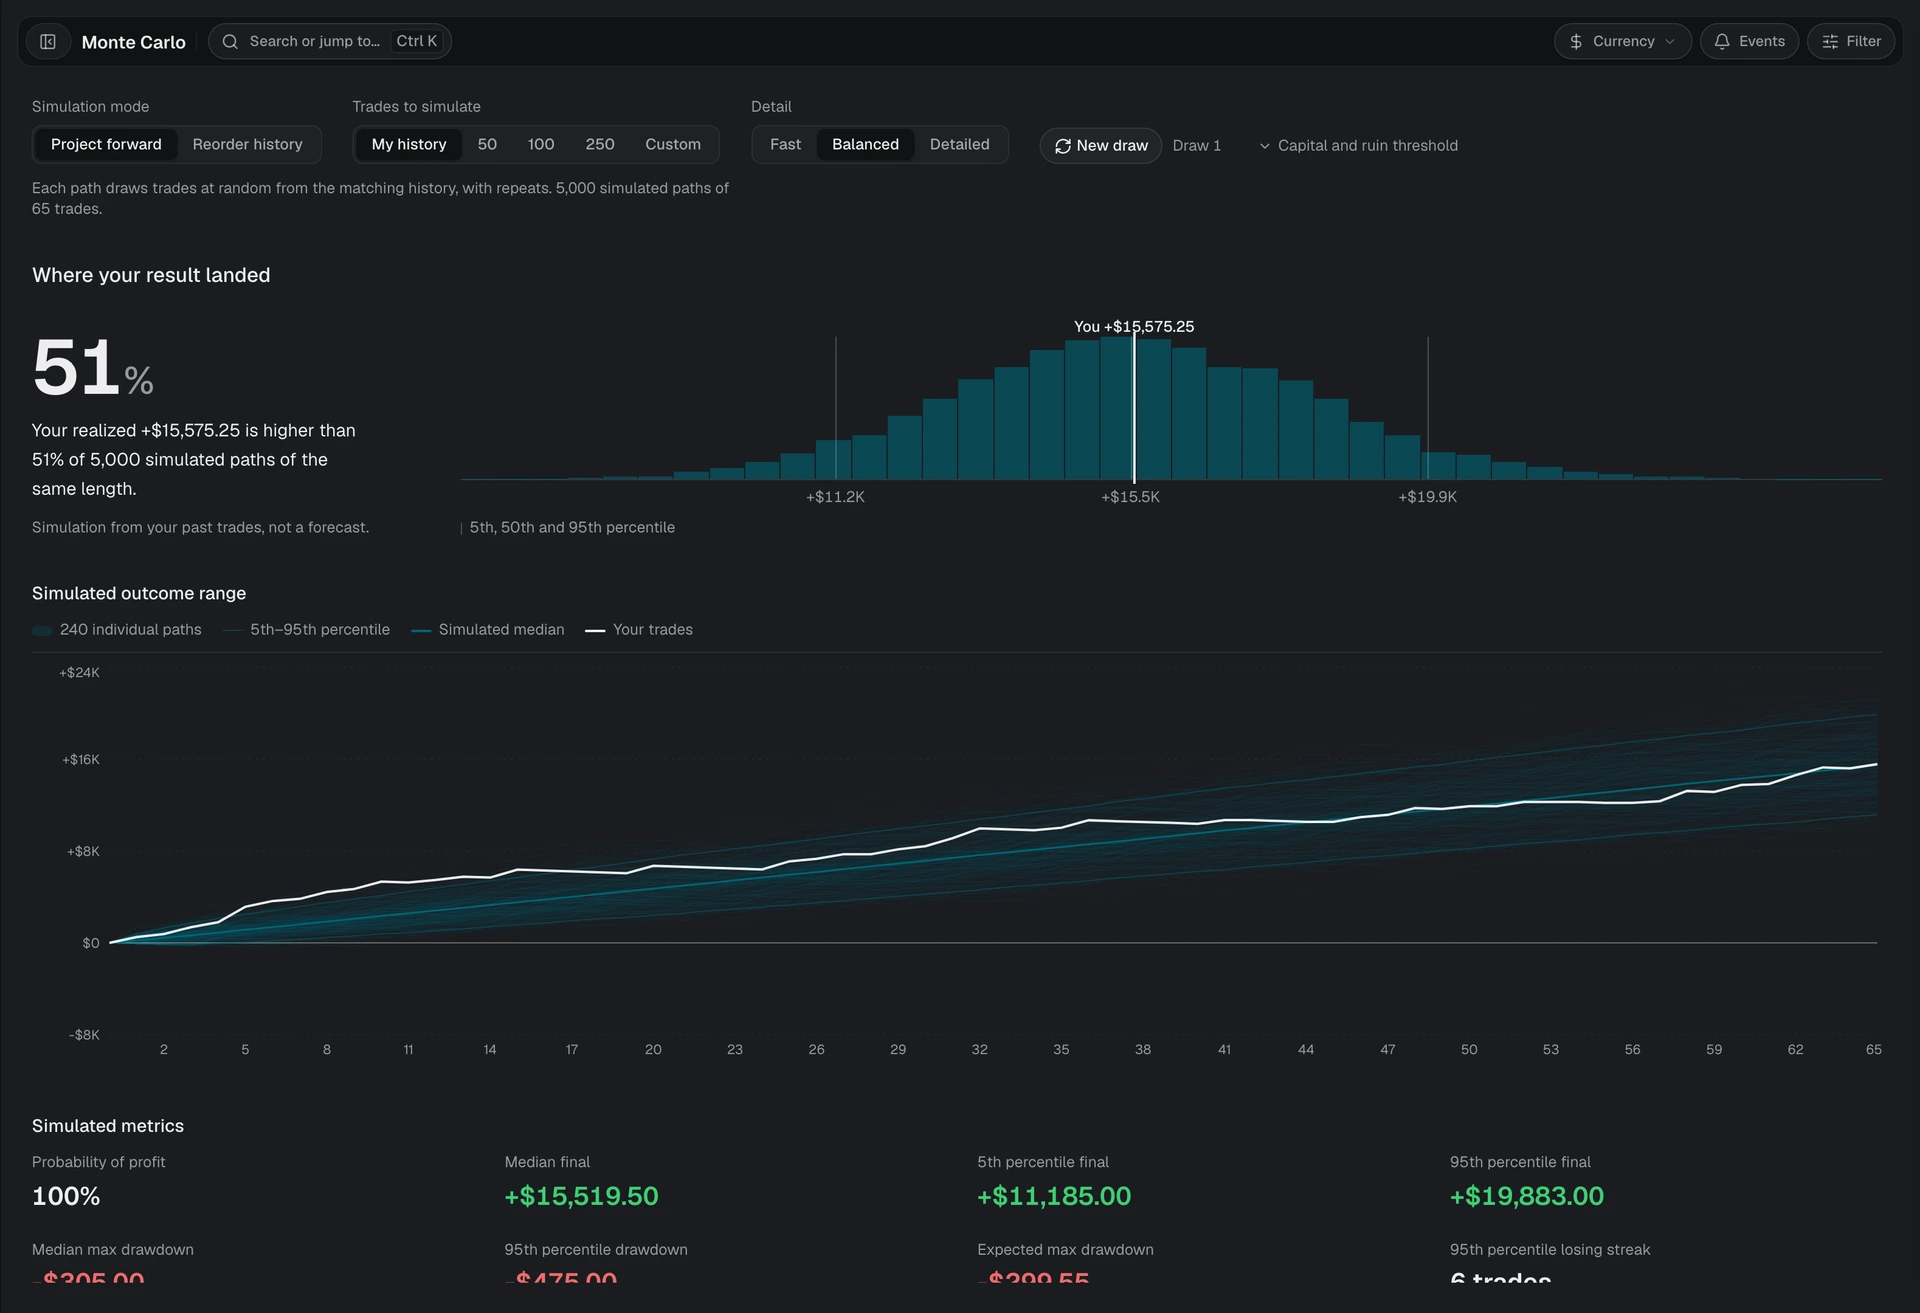
The page follows your active account scope, filter, P&L display mode, timezone, and resolved currency. Only trades that match those controls enter the simulation. A notice identifies trades that the active P&L mode cannot express.
Choose a simulation mode
Project forward draws trades at random from the matching history, with repeats. Set how many trades each path contains. Use this mode to measure the range that the observed trade distribution can produce over that horizon.
Reorder history uses every matching trade once in each path and changes only their order. Every path ends at the same total. Use this mode to measure how trade order affected drawdown and losing streaks.
Set the run
- Trades to simulate sets the projection horizon. My history matches the current number of trades. Presets cover 50, 100, and 250 trades, and Custom accepts another horizon.
- Detail selects Fast, Balanced, or Detailed. More detail requests more paths. Tradeways can reduce the path count to keep the calculation inside its compute limit.
- New draw starts the simulation with another random draw. The button is unavailable while the calculation runs, the draw number confirms which run is shown, and the previous result fades until its replacement is ready.
- Capital and ruin threshold adds starting capital and the percentage loss that counts as ruin. These controls are available only when the active P&L mode has a money or percentage scale.
The page stores these run settings on the current device.
Read the result
Where your result landed places the realized result inside the simulated distribution when the history and simulated horizon are comparable. In projection mode, it compares the realized final result with simulated paths of the same length. In reorder mode, it compares the realized maximum drawdown with reordered versions of the same trades.
The outcome chart shows individual paths, the simulated median, and the 5th to 95th percentile range. The metric cards report the measures that apply to the selected mode, including probability of profit, final-result percentiles, drawdown percentiles, ruin probability, and the 95th percentile losing streak. Distribution charts show where simulated paths are concentrated.
Percentiles describe the simulated paths. For example, a 95th percentile drawdown means 95% of simulated paths had a smaller drawdown. It is not a guaranteed worst case.
Limits and data states
- A small-sample notice means the matching history may not contain losses that occur less often than the sample can show.
- Simulated paths cannot contain a single loss deeper than the worst loss in the matching history.
- Trades that overlapped in time are processed one after another.
- No trades match the active filters means the current account scope or filter has no usable records.
- A stale-data notice keeps the previous simulation visible when trade data cannot refresh. Select Retry to request it again.
- A simulation error provides a separate Retry action for the calculation.
Treat the downside range as a measured limit of the historical sample, not a worst-case boundary.