

Local Data
Import candle history from your broker into this browser to chart trades on your own prices and calculate MFE, MAE, and P&L paths.
Local Data
Import a candle CSV from your broker to chart your trades on your own prices. Tradeways also uses those candles to calculate each trade's excursions and P&L path. Open the page in Settings → Data & privacy → Local data.
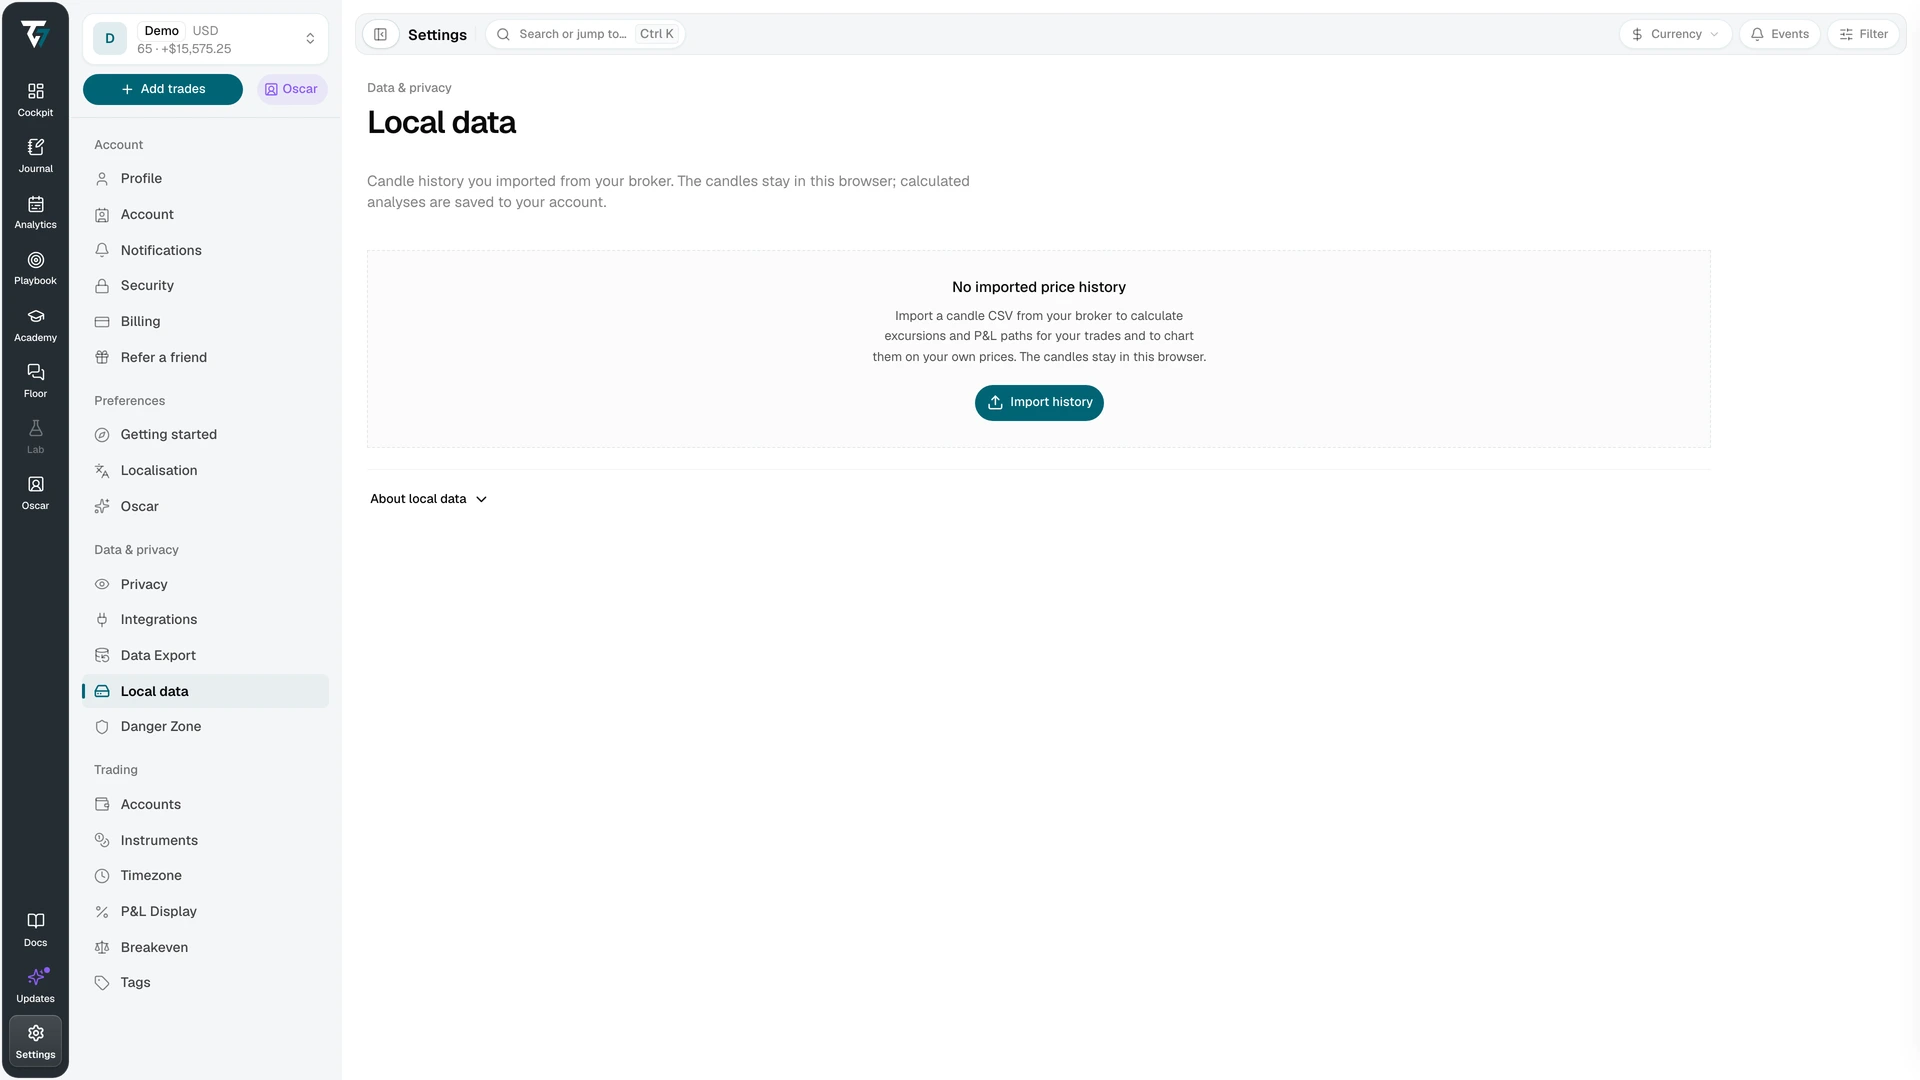
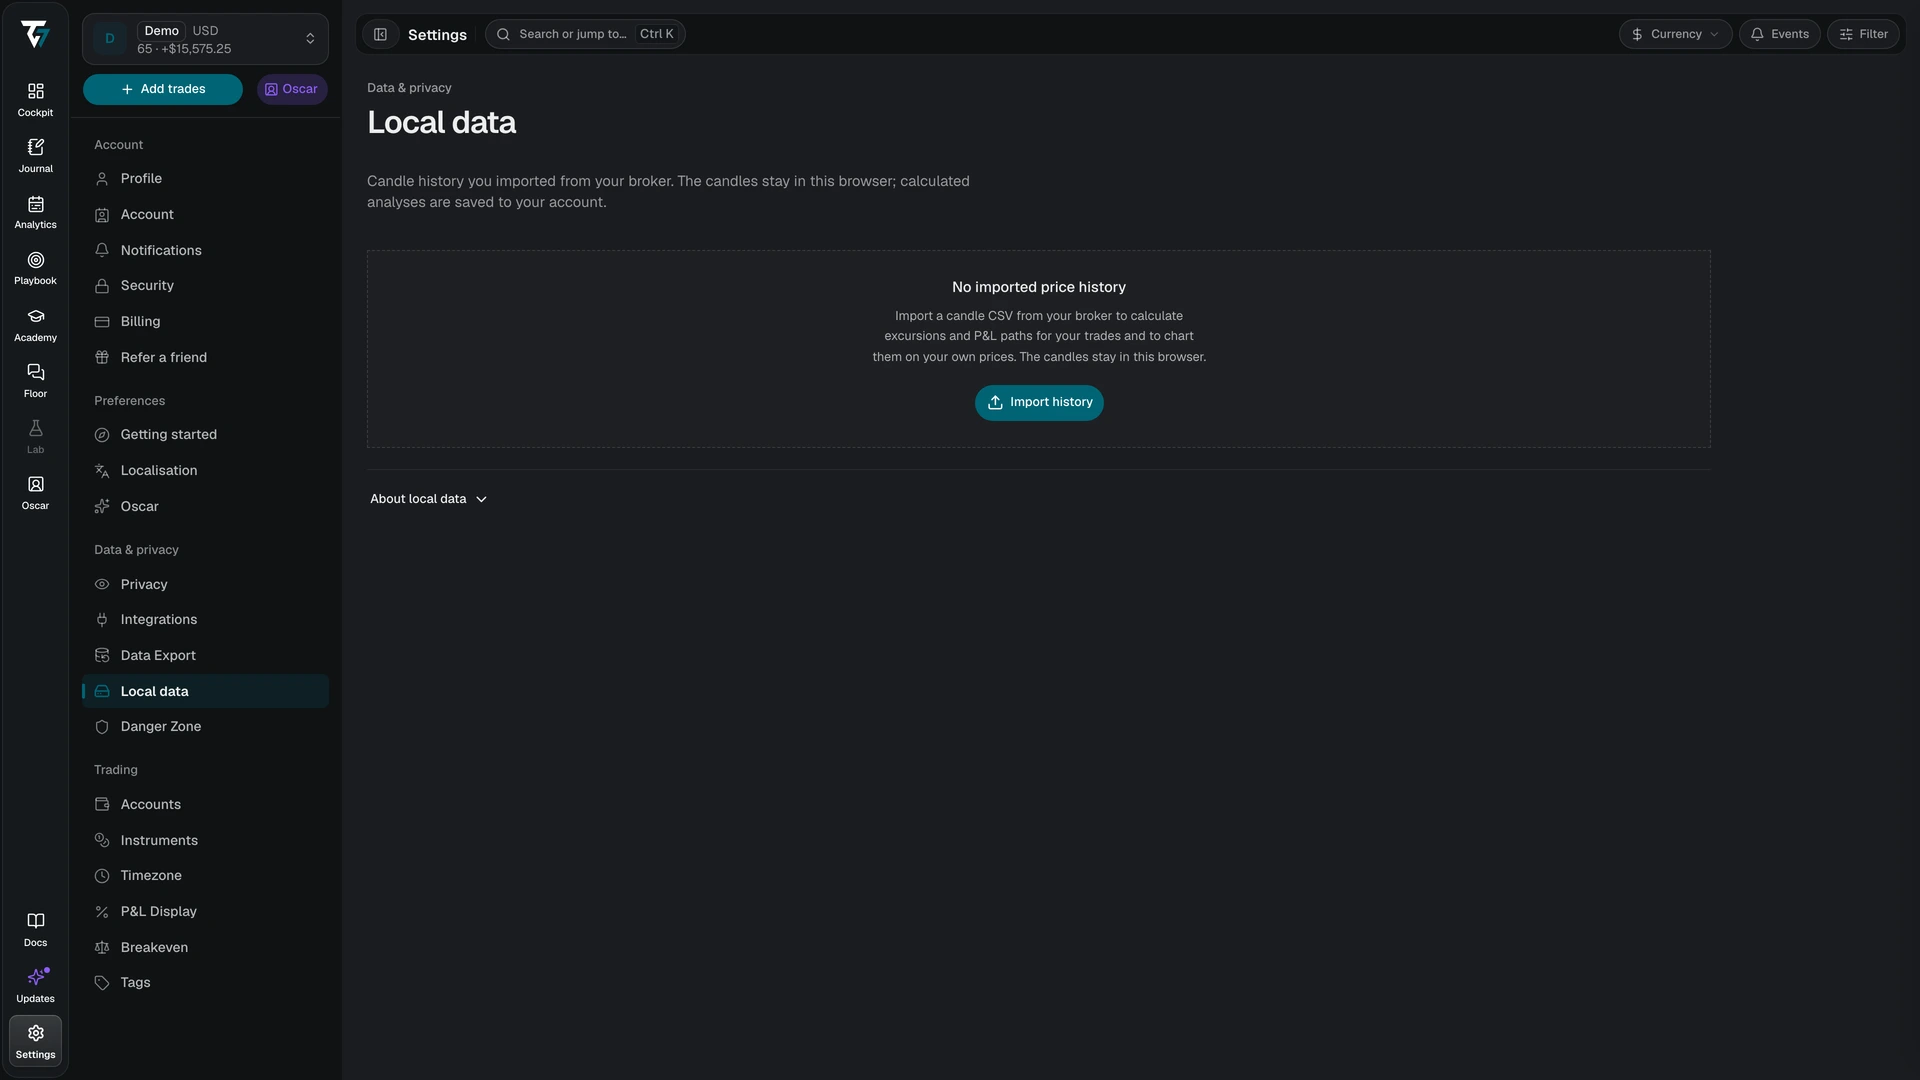
The candles stay in this browser. Only the results of the calculations are saved to your account. Another browser, or this one after its site data is cleared, starts without the history, so keep your original files.
Local data is not available in mentor view. Leave mentor view to manage your own history.
Where the Data Lives
| Stored in this browser | Saved to your account |
|---|---|
| Candles | Calculated trade results |
Removing a history deletes the candles from this browser and keeps the results already saved to your account. Those results stay available on other devices and in shared-account views, and they are marked as calculated from uploaded candles.
Browsers can clear site data when storage runs low. Open About local data to see how much browser storage this site uses and whether it is protected from automatic cleanup. If it is not, keep your original files or export a backup.
CSV Format
One row per candle: timestamp, open, high, low, close, and an optional volume. Timestamps are candle start times. Commas, semicolons, and tabs are accepted as separators, and a header row is optional.
| Limit | Value |
|---|---|
| File size | 100 MB per import |
| Candles per history | 2 million |
| Native intervals | 1s, 5s, 15s, 1m, and 5m |
The interval and the date order are read from the file. A file with a malformed price row, overlapping candles, conflicting duplicate rows, or a local time that occurs twice is rejected as a whole, and no data is changed.
Import History
Select Import history and choose a file, or drop it on the dialog. Tradeways reads the whole file before it saves anything and shows a preview:
- Candles: how many the file contains, and how many were filled from the previous close
- Interval: detected from the file
- Date order: detected, or chosen by you
- File timezone: applied to timestamps without an offset, defaulting to your display timezone
- Coverage: the period the candles cover
Each setting is marked as detected or chosen, and you can change an inferred setting before you save. When a file can be read with two date orders, choose the range that matches your export. When the file does not show its interval, choose the one it was exported with. Changing the file or a setting makes Tradeways read it again.
The file does not name an instrument, so you describe it next:
- Asset class and Symbol, exactly as in your broker's export
- For futures, Contract for one exact contract symbol, or Continuous root for a rolled series. A continuous root is for charts only, because trade analyses need an exact contract.
- Import into: the account the history belongs to, which defaults to the active account
- Also use for: other accounts that should use the same candles
Only trades in exactly the same instrument are matched. The candles are stored once, however many accounts use them.
An import into an instrument that already has history extends it. Candles at matching timestamps are replaced, and new candles are added. The interval must match the stored history. To switch to a different interval, remove the stored history first.
Each file is treated as a complete export of its own period. Intervals with no trades inside the file are filled with a flat candle at the previous close and zero volume. Gaps between separate files stay missing and are not filled with hosted prices.
Inventory
Each stored history is one row with its instrument, covered period, interval, and the accounts that use it. A row shows No gaps or the number of gaps. The accounts column appears when you have more than one account. Times use your timezone setting.
Search by symbol and filter by account appear once the list grows beyond a few histories.
A line above the list reports what the background analysis is doing: checking trades, calculating, saving, offline, or an error with Retry saving. The count is the number of trades updated in this session, not a total of saved trades. Analysis only runs while Tradeways is open in the browser that holds the candles.
History Details
Select a row to open its details:
- Add history imports more candles into this history.
- Export CSV downloads a backup. It keeps the gaps, so importing it again restores the same coverage.
- Coverage lists the covered periods and the gaps.
- Accounts selects which accounts use these candles. An account with its own history for the same instrument uses that history first. An account that already uses another shared history for the instrument cannot be added. Removing an account keeps its saved analyses.
- Remove data deletes the whole history, or a date range.
Remove a Date Range
Choose the first and the last day. The days are measured in your timezone, and the last day is included. The page shows how many candles are removed before you confirm. A removed range becomes a gap, and gaps between ranges you keep are preserved.
Removing or correcting a shared history changes it for every account that uses it. After a removal, charts use hosted prices again where they are available, and you can import the files again.
Charts and Trade Metrics
When a trade has local candles, the Trade Detail chart draws them instead of hosted prices. The chart's Upload chart data button opens the same import for the trade's instrument, with the trade's window in the preview. It shows whether the file covers the trade fully, partly, or not at all. A file that does not cover the trade can still be added.
Local candles are the only price source for that instrument. Hosted prices do not fill their gaps, and the chart says when no uploaded candles cover the range.
A metric needs candles that cover its own time window. MFE and MAE need the whole trade. Continuation needs the window after the close. A part can stay unavailable while another part is complete, and the reason is saved with it. Metrics also need candles fine enough to separate the trade's executions. Executions keep their recorded prices.
The server checks the structure of the results and the P&L derived from the executions. It cannot check the candle prices themselves, so these results are labeled as calculated from uploaded candles. A change to the trade or its instrument hides the saved results until they are recalculated.