Trade Detail
The single-trade view. P&L breakdown, chart with your executions, the four-tab journal, editable executions and TP/SL levels, rule compliance, and the actions menu.
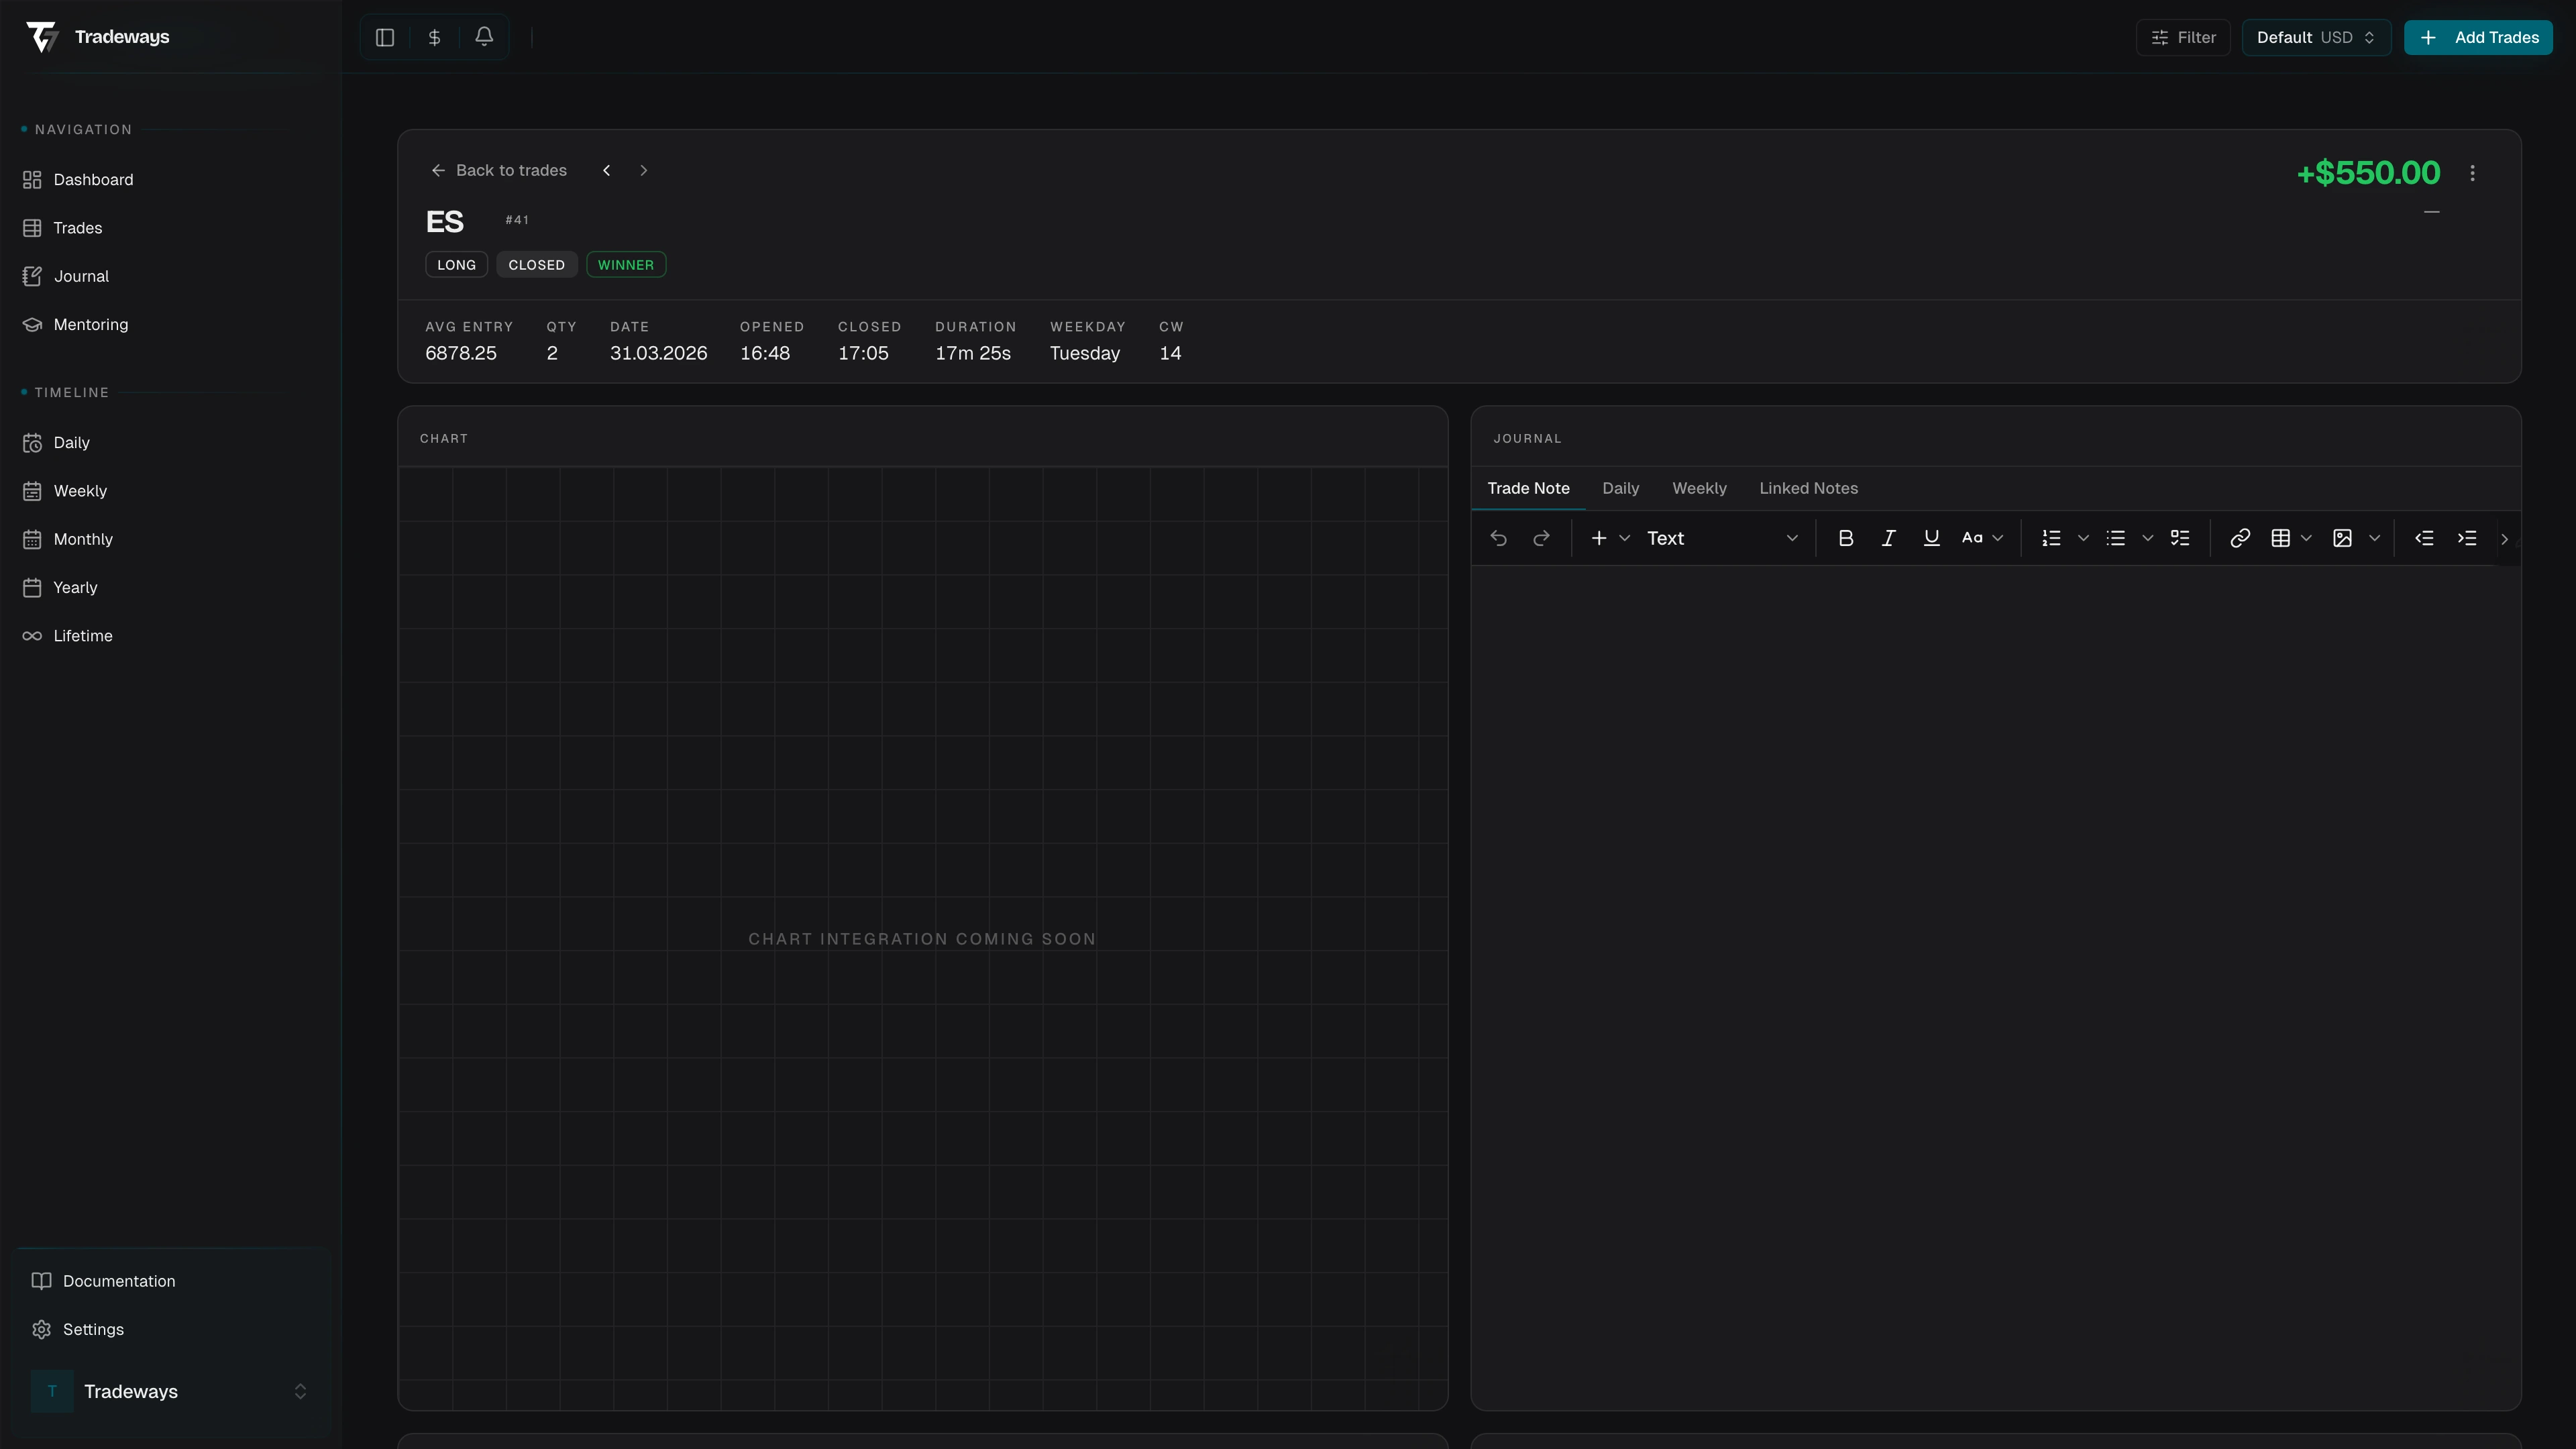
Trade Detail
/trade/<tradeId> is where you study one trade after the fact: read the numbers, look at the chart with your fills on it, write up what happened, and clean up anything the import got wrong. Open it from the Trade Log, the Month View, a Dashboard widget, or any journal entry that mentions a trade. The Previous and Next arrows next to the symbol step through the trades sitting alongside this one in whichever list you came from, so you can review a session without bouncing back to the table.


The numbers up top
The top of the page is read-only. Every figure is computed from your executions and adjustments. Most of it is what you'd expect, but a few tiles do real work.
P&L is the net result in whatever display mode you've chosen (currency, percent, R, points, or ticks). When commission is non-zero in currency or percent mode, you also see Gross P&L and a separate Commission value so you can tell broker drag from market drag. Adjustments appears whenever swap, dividend, funding, borrow, or extra-commission entries exist on the trade; the figure here is signed, so positive means the adjustments helped you.
Tech R:R is the planned reward-to-risk derived from your current TP/SL levels. Once a level is hit, the same slot flips to R, the realized multiple. The result badge (Winner, Loser, or Breakeven) only appears on closed trades and respects your breakeven threshold, so a trade that scratches for two ticks doesn't get labelled a loss. Avg Entry is volume-weighted, not the first fill. If you scaled in, this is the number to compare against your plan, not the entry on your first execution.
Three excursion tiles, MFE, MAE, and MCE, sit alongside the rest. Each has a hover card with a tiny diagram and a plain-English explanation, but the short version is this.
- MFE (Maximum Favorable Excursion). The best unrealized P&L this trade ever showed before you got out. A large MFE next to a small realized P&L is profit-taking too early, not luck.
- MAE (Maximum Adverse Excursion). The worst unrealized P&L on the way to your exit. Large MAE on winners means a loose stop or no stop. Consistent MAE near zero on losers usually means your stop is too tight.
- MCE (Maximum Continuation Excursion). How far the market kept moving in your direction after you closed. A large favorable MCE means you left money on the table; a reversed MCE means your exit was on time.
These are computed from intraday market data. Right after a trade is imported you may see a "Backfilling market data" hint; most symbols fill within a few hours, some futures can take a day. If something looks wrong after the data has caught up, select the trade in the Trade Log and use Reset metrics in the bulk actions to recompute from scratch.
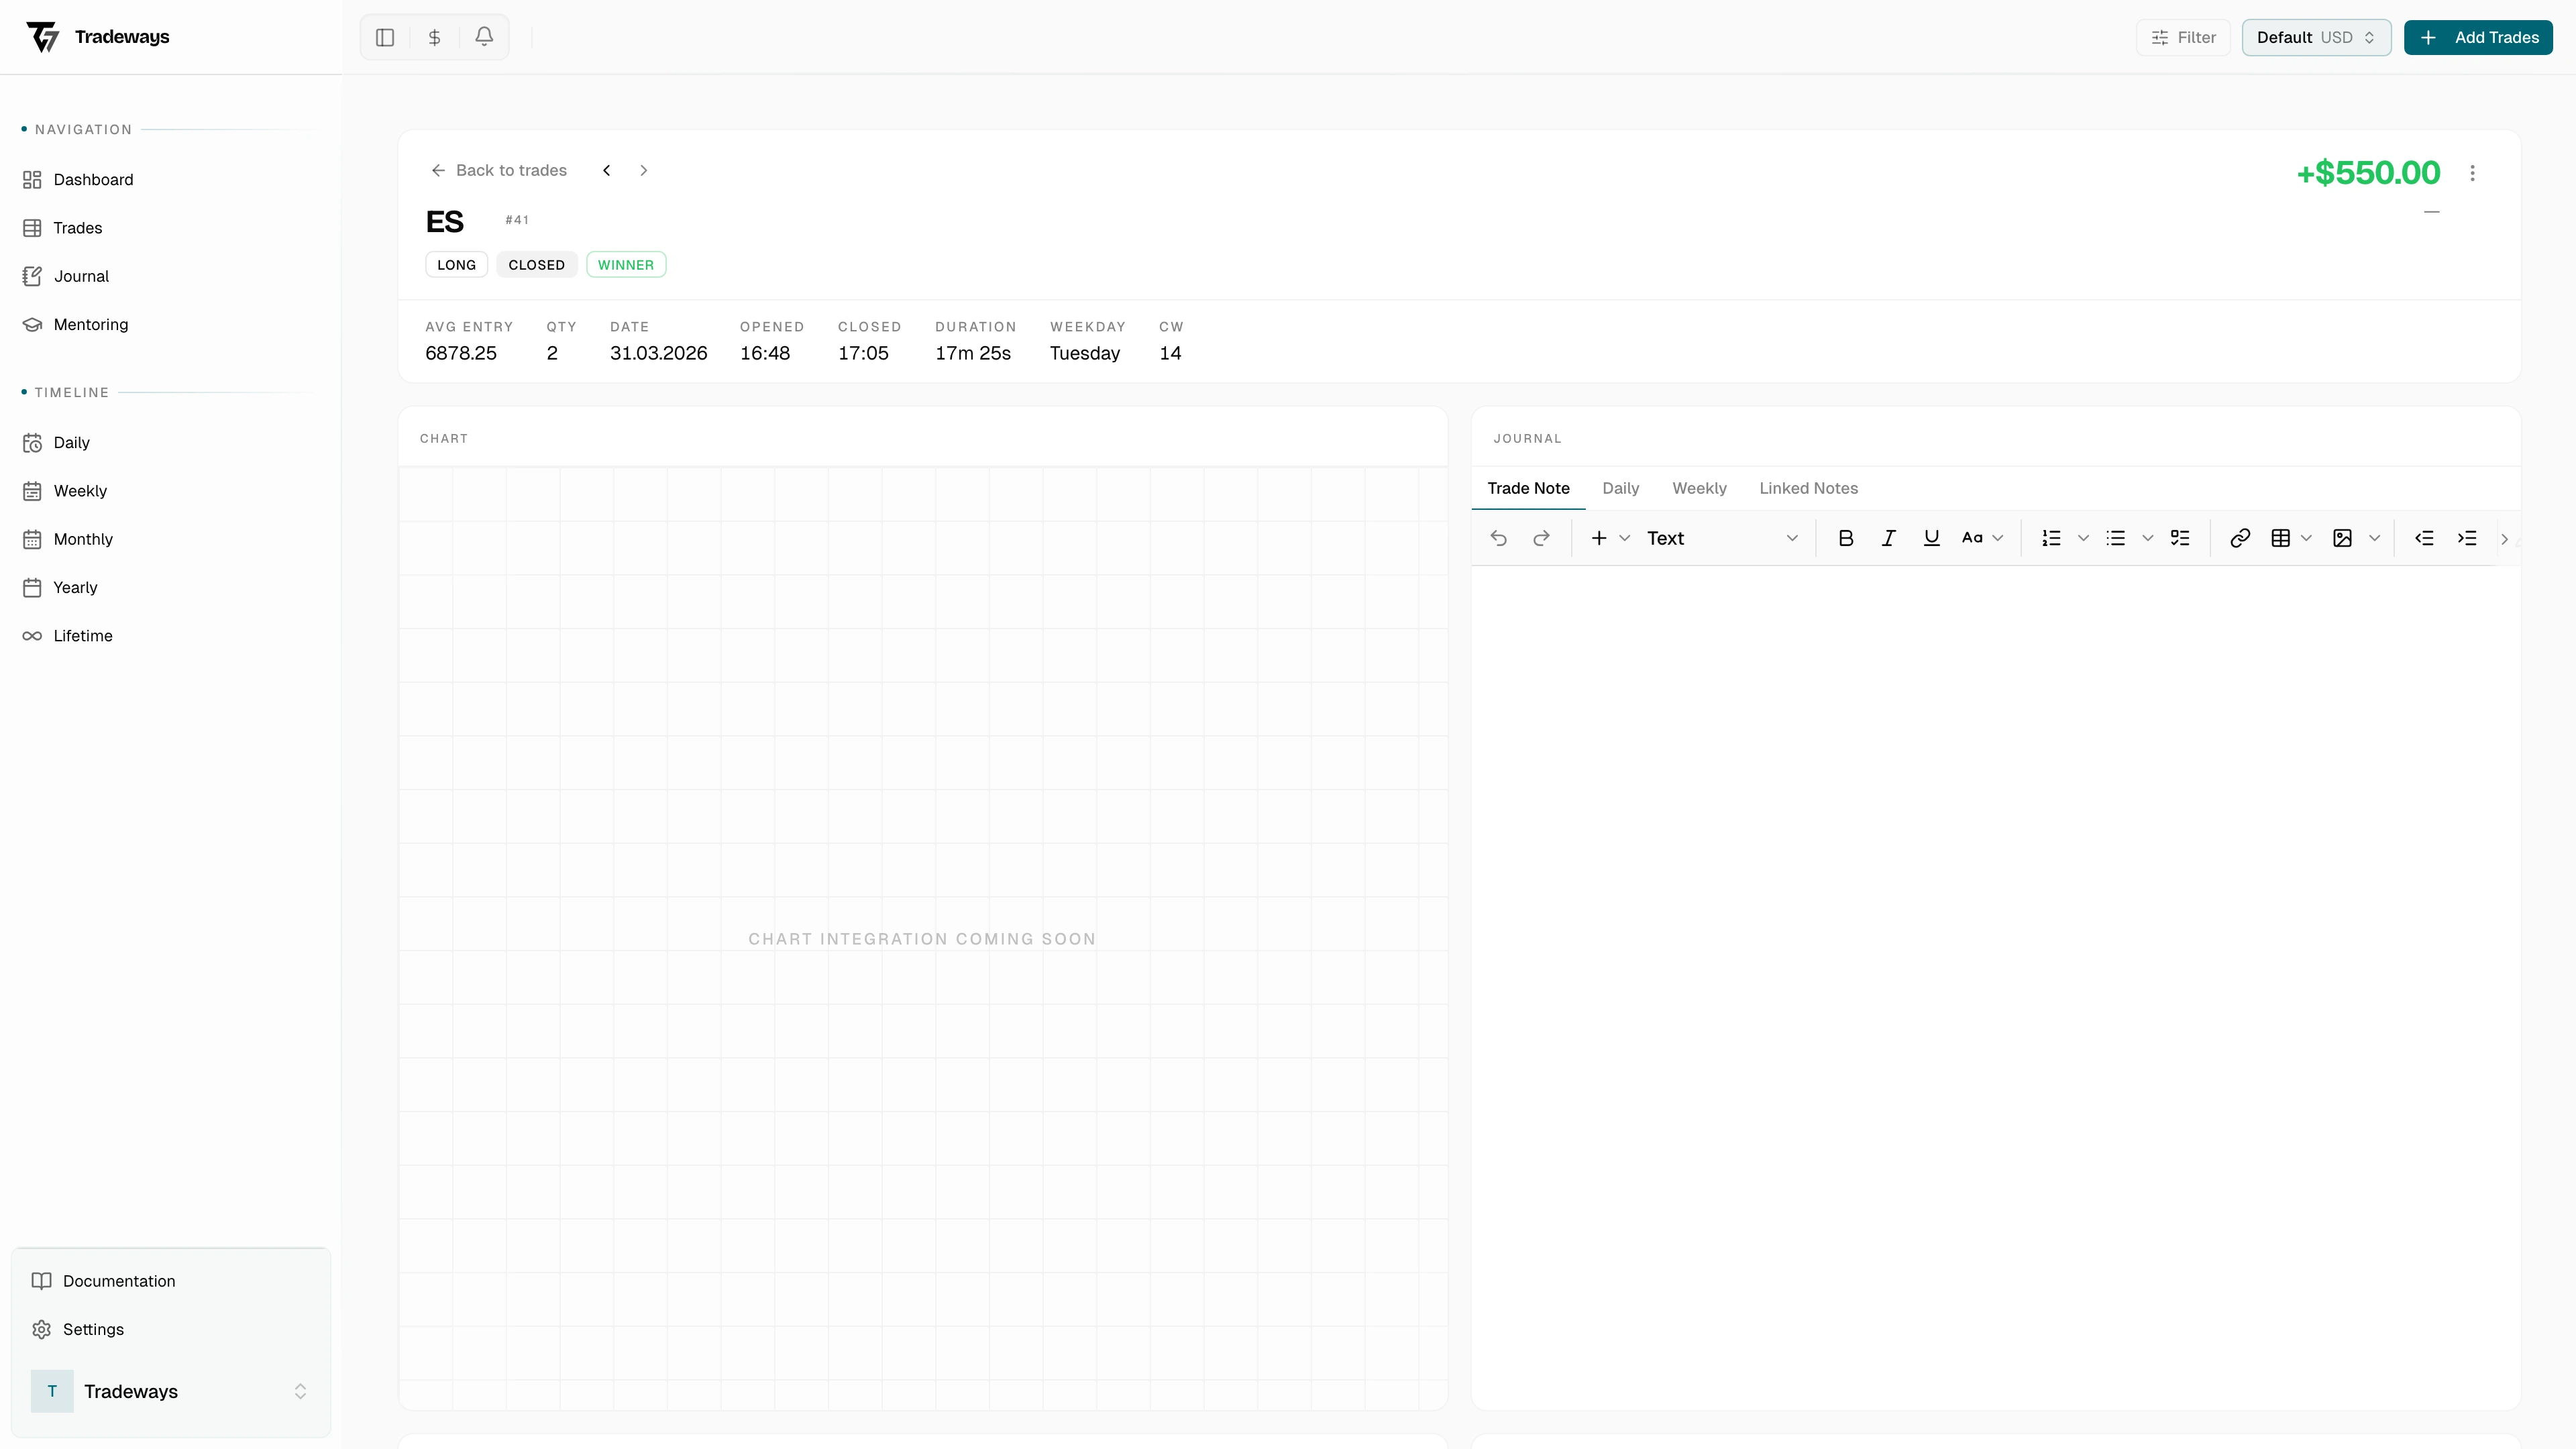
Chart

The chart shows the trade in context. Your entries and exits sit on the candles as markers; if you have TP/SL levels, the reward and risk zones are shaded behind the price. The timeframe selector defaults to something sensible for the trade's duration (a five-minute scalp won't open on the daily) and the choice is remembered per user. Available resolutions go from 5s up to 1D and depend on what data exists for the symbol.
The gear icon opens chart settings. The defaults are reasonable; you only need to touch this when reviewing on a different monitor, accommodating colour blindness, or hiding clutter for a screenshot. You can change candle colours, toggle the grid and crosshair, switch execution markers between triangles, diamonds and dots, control what shows on the marker labels (price, quantity, both, or nothing), and pick how the side is labelled (none, B/S, or Buy/Sell). Reset to defaults undoes all of it.
Drawings are saved per trade and sync across devices; see Chart Drawings for the full toolset. The trash icon in the drawing toolbar removes every drawing on the current trade in one step. There's no undo, so think before you click.
For futures contracts and a handful of FX and index CFDs, the chart renders against a continuous reference series rather than your broker's tick stream. The shape of the move matches what you traded, but the exact tick prices and overnight gaps can differ. When that's the case a small note appears under the chart.
Journal
A four-tab journal sits next to the chart. Every tab is scoped to this one trade.
- Trade Note. Free-form text attached directly to the trade. Use this for the why: what setup you saw, what you were thinking, why you exited where you did. Edits autosave.
- Daily. A preview of your daily journal for the day this trade opened. If no entry exists, the buttons here will create one; if one exists, you jump straight to it. Useful when you want to read the morning's preparation against the trade you actually took.
- Weekly. Same idea, scoped to the open week. The right place for "this trade was part of my breakout-Monday theme" context that doesn't belong in either the trade note or the daily.
- Linked Notes. Any other notebook page you've connected to this trade, plus a Link Note button to attach more. Use this for evergreen pages: playbooks, post-mortems, references. Each linked note has its own menu to unlink (the note itself isn't deleted).
If you keep a real journal practice, the rule of thumb is this. Trade-specific reasoning goes in Trade Note. Anything broader you'll want to read again later belongs in Linked Notes. The daily and weekly tabs are read-mostly windows into your higher-level journal.
Executions, adjustments, and levels
Below the chart is the part of the page you actually edit. Three sections: Executions, Adjustments, and Levels.

Executions
Each fill shows as a row: side, quantity, price, date. When there's more than one fill, the bar on the left visualises their relative price spacing, a useful tell for whether your average entry is dragged by one outlier or built evenly. Hover a row to reveal pencil and trash icons; inline-edits commit on the check and abandon on the X.
The + at the top of the section adds a new execution to an open trade. A fill that would flip the position (a sell larger than your remaining longs, for instance) is rejected; close the rest first and start a new trade in the other direction, otherwise the FIFO accounting falls apart. For futures, you can't add executions until the contract has been resolved on the trade.
Most users only edit executions to fix import issues: a missed fill, a wrong price, a duplicate from a noisy broker feed. If you're typing executions in by hand often, importing or live-syncing from your broker is almost certainly worth setting up.
Adjustments
Adjustments are money in or out that didn't happen as a fill. Five types:
- Swap. Overnight financing on margin positions.
- Dividend. Paid to you on long stock, withheld from you on short.
- Funding. Perpetual-swap funding payments on crypto.
- Borrow. Share-borrow fees on shorts.
- Commission. Extra commission your broker tacks on outside the per-fill amount.
Click + to add one: pick the type, enter an amount (positive is a credit to you, negative is a charge), pick a date. The amount is in the trade's settlement currency. Adjustments roll into net P&L; see Trade Adjustments for the full picture, including how a swing trade's overnight swaps add up across days.
Levels
The Levels block is where you record what you actually planned: take-profit and stop-loss prices, optionally with a quantity for scale-out plans. Click + Add to enter one, click an existing level to edit, use the trash icon to remove.
Each level can be entered three ways.
- Price. The absolute number, as it would appear on your DOM.
- Ticks. The distance from your average entry in instrument ticks. Easier when you're thinking in "thirty ticks of risk" rather than absolute prices.
- Currency. A dollar (or euro, or yen) amount you're willing to risk or trying to make. Tradeways back-solves the price from your entry, direction, quantity, and an FX rate if the trade is in a non-account currency. If the FX rate for that date isn't in the system yet you'll see which pair needs backfilling.
The Tech R:R in the header up top comes straight from the active TP/SL pair. Below the editor, a History section shows every level that was ever set on this trade (replaced, hit, or removed) so you can see how your plan evolved while you were in the position. This is the single most underused part of the page for traders working on discipline: looking at how often a stop got "moved" tells you a lot.
Rule Compliance
If the trade is linked to a strategy with trade rules, a Rule Compliance card appears here. Each rule is listed with its pass/fail state and an "X of Y passed" summary at the top. Manual checks can be flipped from this card. The card is a review tool, not a gatekeeper. Failing rules don't block anything; they just give you something concrete to address when you write up the trade.
Custom fields, images, and linked context
If your account has custom columns configured, they appear as their own section on the right. Checkboxes toggle on click, selects open a dropdown, text fields autosave on blur, and tag fields multi-select against the column's tag pool. Anything you fill in here also appears as a column on the Trade Log, and you can filter the log by those values.
Below custom fields is the image area. Drag and drop screenshots, broker confirmations, or anything else onto the upload zone, or click to browse. Click a thumbnail to open the lightbox; the arrow keys step through. The Trade Log's Images column shows the count, so trades with attachments are easy to find later.
Actions menu
The three-dot menu in the top right is the only place to do anything destructive or schema-changing on the trade. Items adapt to trade state; Force Close Trade only appears for open trades.
- Edit trade. Scrolls down to and highlights the executions and levels section. A keyboard-friendly shortcut to the same controls described above.
- Change instrument. Reassigns the trade to a different symbol. For futures, you also pick the matching derivative contract. P&L and chart data are recomputed against the new instrument.
- Mark reviewed / Mark unreviewed. Flips the reviewed flag. The flag is also visible as a badge in the header and is filterable in the Trade Log, so this is how you keep a "to review" queue.
- Assign strategy. Same picker as the bulk action in the Trade Log, scoped to this one trade. Add, replace, or remove a strategy assignment.
- Move trade. Moves the trade into another account, assigning a fresh trade number in the destination. Useful when an import landed in the wrong account.
- Force Close Trade. Open trades only. Closes the trade at the current P&L without an offsetting execution. This bypasses the execution model, so reserve it for orphaned trades where the closing fill never imported. Hold Shift when clicking to skip the confirmation dialog.
- Delete Trade. Moves the trade to the trash. It's restorable for 30 days from there. Hold Shift to skip the confirmation.